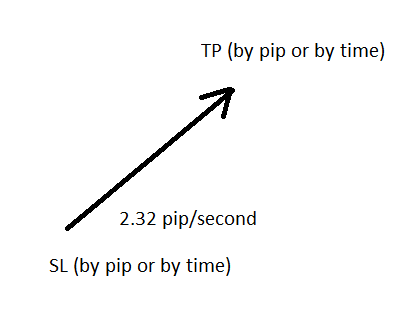
Trade based on the velocity of price moving for a small profit with a large number of trades

Avatar
  • updated

I will present my ideas on how to trade by taking advantage of market volatility in a very fast time. by utilizing the speed of movement of the pip within a certain time which I call velocity. This strategy requires a data tick which is the smallest timeframe.


Image 1268

t1 = interval 1

t2 = interval 2

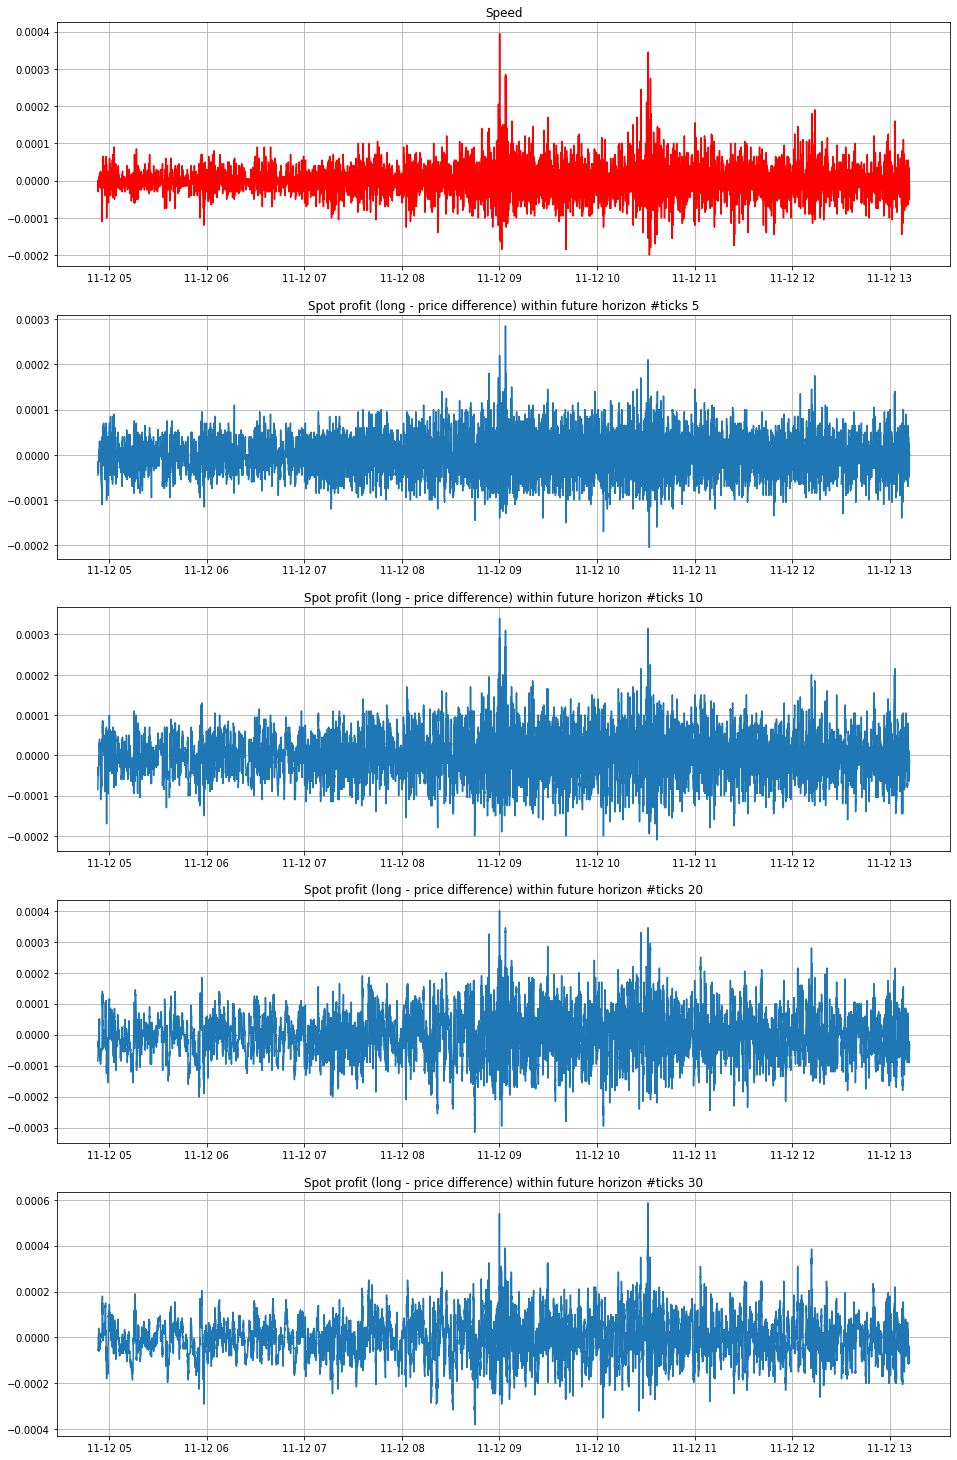
v1 = The average speed of the price during the last t1 minute (pips / second)

v2 = The average speed of the price during the last t2 seconds (pips / second)

acc = The limit by which a significant difference of v1 and v2 can be considered for opening a position

This strategy is expected to produce a high level of accuracy with small profits but a very large number of trades.

  • The prices used in the calculation are assumed to be the average of the bid and ask prices.
  • When calculating the average price speed, if the previous tick price was smaller than the current tick, the speed is added. If the previous tick price is greater than the current tick, the speed is reduced. As a sign of the direction of price movement. An example of calculating the average is on attachments.
  • If the difference between v1 and v2 is greater than acc%, then open a position
  • Trade can be closed by pip target or by time + spread
  • Requires very low latency
  • Expected to very helpful during unexpected sudden moves

Attachment:

example velocity calculation on 3 second

Avatar
0
Sai Pratap

Good idea.

But Trailing SL and profit booking shud be very important. Thanks.

Avatar
0
Hannes Waser

That is very interesting. I heard from some people that such approaches work (but not in its simple form - probably some scaling and money management will do the rest).

Do you have some evaluations or sources from blogs, where people state that this might work?

What TP do you aspire for a single trade? Given the spread, this might be an issue with most brokers.


Avatar
0
Sai Pratap
Quote from Hannes Waser

That is very interesting. I heard from some people that such approaches work (but not in its simple form - probably some scaling and money management will do the rest).

Do you have some evaluations or sources from blogs, where people state that this might work?

What TP do you aspire for a single trade? Given the spread, this might be an issue with most brokers.


Yes the set file may need custom optimization for each broker/setup.

Spread, latency, order execution time etc will impact a lot in these scenarios. Can result out to be very risky.

Avatar
1
Hannes Waser

Ohkay, if some of you are familiar with parallel diagrams, you will understand it right away. if not, here is a short explanation:

Each line running from very left to very right is one sample - measuring the ticker speed and look at the future prices after this measure.

After measuring the tick speed (12.th Nov 2020, EURUSD) the price after 5, 10, 20 and 30 ticks have been collected too. These values are represented by the "spot_5", "spot_10" etc columns. So If a line runs from the speed of 0.0002 to spot_50= 0.00000 that means, that after measuring the speed of 0.0002 the mid price (bid + (ask-bid)/2) was observed to be 0.00000.

The max_5, max_10 etc values are the maximal prices between the moment of the speed measurement and the time 5, 10 or 20 ticks later.

Now the question, is there some significant dependency between the speed and the future price?

You can play with the interactive (hiplot) chart I attached here.

In summary: From the experiment there is no significant dependency.

However, one might be there is we accumulate the speeds over an hour or so and derive statistics such as mean and stdev.

HiPlot Result

How to use: Select only larger speed values (drag and drop on the column) and see how these are distributed.

Now you see, that some of them are followed by higher prices, but most of them are not. So maybe this is rather an indication of price reversal if the speed is high...

PS: Here is how it looks as a sequence

Avatar
1
Hannes Waser

As expected, when we use larger time horizons (measuring the speed over last 10 seconds and check the price difference for the next 500 ticks), the result looks much  better.