My strategie, scalping

hello
My name is Donovan, I am a user of community power for 1 year.
I have a strategy for you, I do not know if it is possible to build it automatically, unfortunately I am a noob in infomatique and I am very bad in English so difficule to understand. It is a very simple method and it is likely that it exists but I have not found it.
My method is simple, the position must be short, using a graph of a period of 1 minute ( see maximum 5 )
It opens the position with the rsi and the macd
It closes the position with the middle of the bollinger band
I- Open the position
As I said earlier, two indicators will be needed to open the position the rsi and the macd.
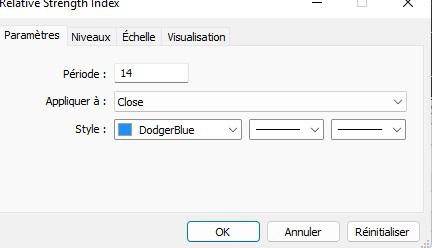
The RSI level is between 30 and 70 over a period of 14; closed.
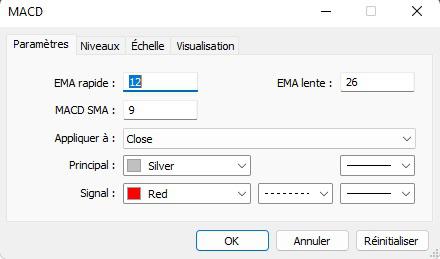
Macd at Fast AMS 12; Slow AMS 26; MACD SMA 9; Closed
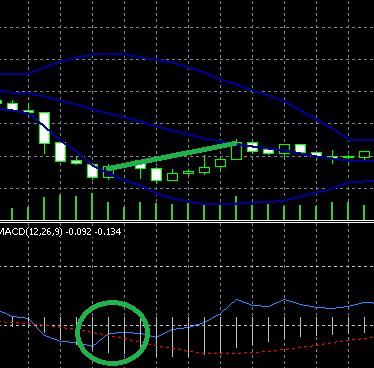
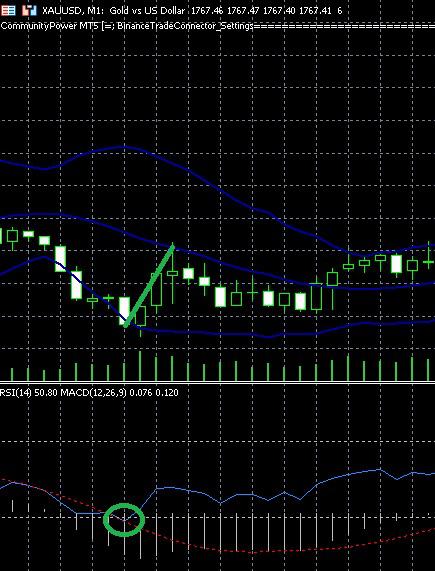
OPEN BUY: When the rsi is below 30 and the rsi is on the red line of the macd
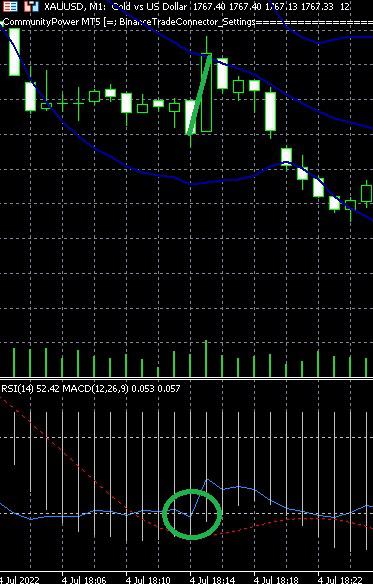
OPEN SELL: when the rsi is above 70 and the rsi is below the red line.
II- Close the position
Is it possible to close a position when the bar touches the median line of the bollinger bands?
The images will be easier to understand, sorry my English.
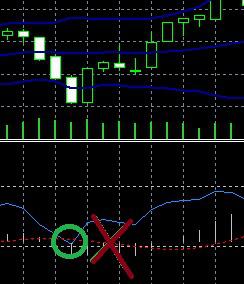
The round is the position opening, the line at the top is the closing.
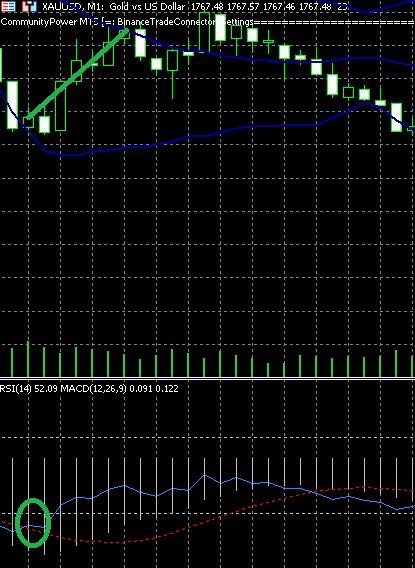
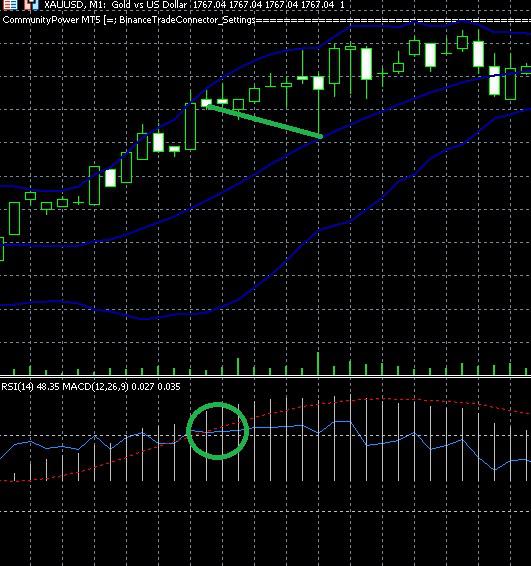
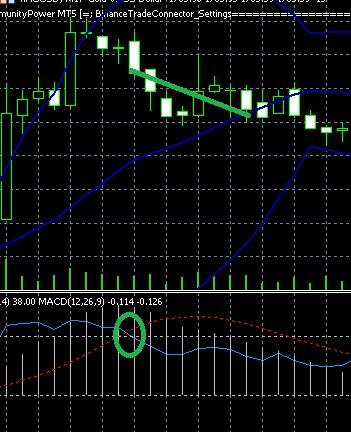
Here an example where position opening is false. If i want open buy, the red line must to be under the rsi
sorry I’m trying to explain my thoughts but it’s difficult:D
thank you all for your help :)


Hello Donovan,
I'm going to try to help you put it together, to see if we can do it together.
I- Open the position
As I said earlier, two indicators will be needed to open the position the rsi and the macd.
RSI and MACD "Open on" => "Open on Collective signal"
The RSI level is between 30 and 70 over a period of 14; closed.
Macd at Fast AMS 12; Slow AMS 26; MACD SMA 9; Closed
OPEN BUY: When the rsi is below 30 and the rsi is on the red line of the macd
Here I am not sure if this option is correct with what you say in your strategy. Maybe someone who knows more can confirm or correct.
II- Close the position
Is it possible to close a position when the bar touches the median line of the bollinger bands?
The line in the middle of the bands is a simple SMA of 20. It is the same as using a Simple Moving Average of 20.
Check it out by placing a Bollinger Band on the bottom and a 20 Simple Moving Average on top.
Could be like this:
I leave you the configuration file.
I recommend that you read the documentation and any questions, let me know.
https://docs.google.com/document/d/1ww1M97H54IBwtCKZDhxtqsTsrtEMKofXHMEWMGCyZNs/edit#heading=h.kxlu8rqcyuty
donovan.set