Paolo strategy
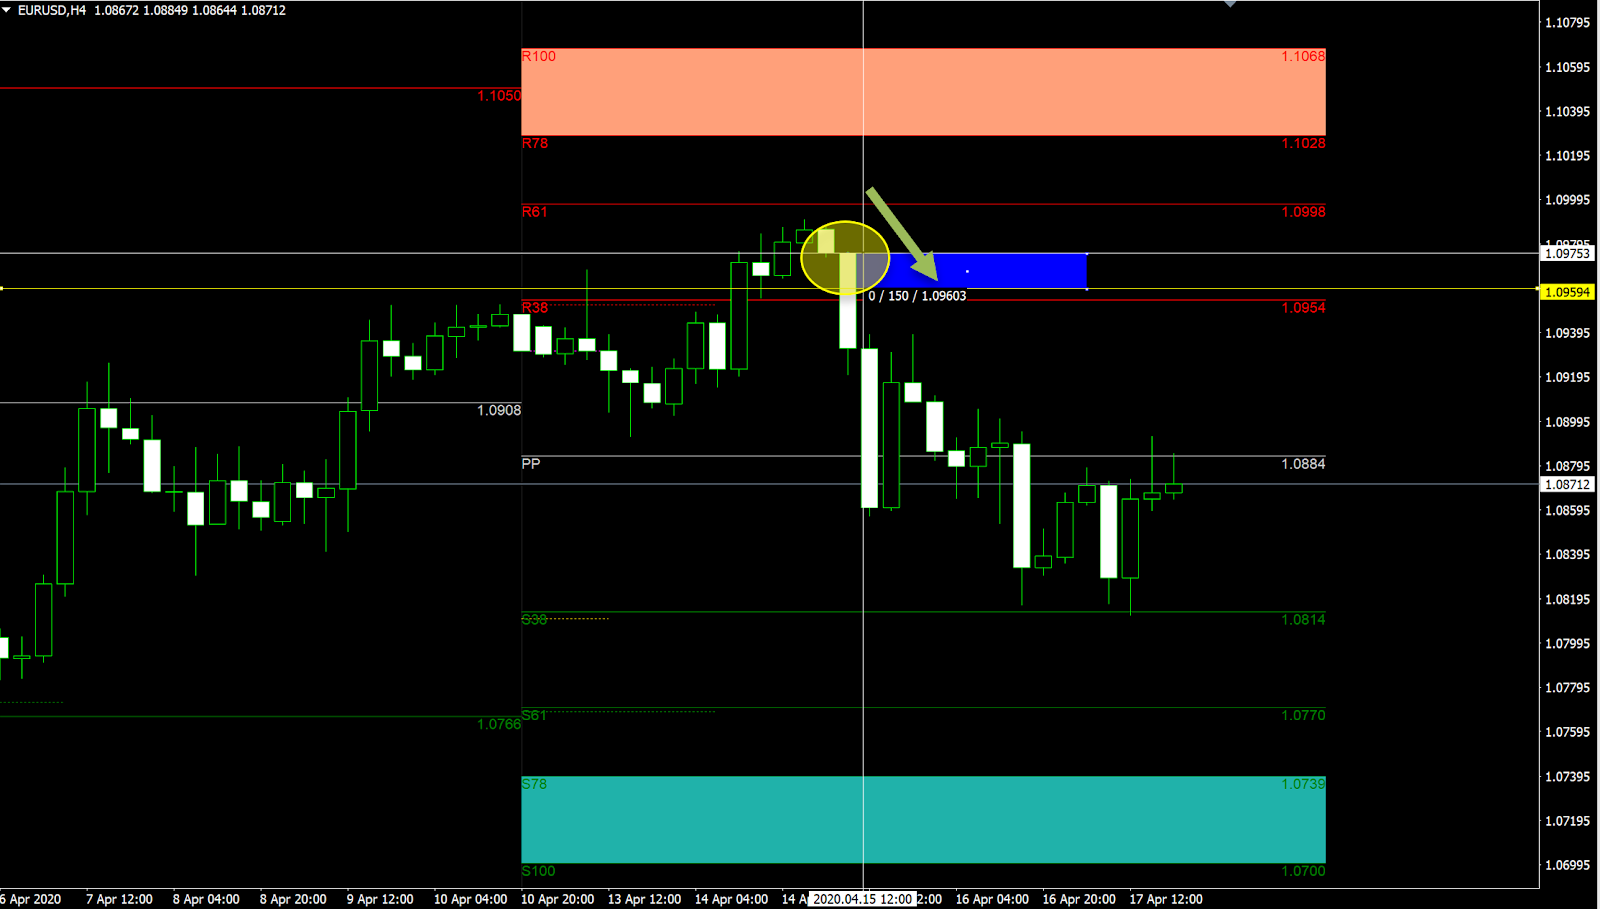
It’s based on price movement around weekly pivot points which identify equilibrium, support and resistance levels (or key zones) of the previous weekly trading session. In a swing trading session, the further the price moves away from PP reaching key zones like RS61 or RS78, the more likely it is to retrace or rebound (if confirmed by price action), best if price is stretched near or above ADR limit (ADR High for resistance, ADR Low for support).
This is done applying pivot points to the chart using data from the previous week to provide support and resistance levels for the current week. Best on H1 and H4 TF.
Calculation of pivot points:
- Pivot Point= (Previous High+Previous Low+Previous Close)/3;
- Support 1 (S1)=(Pivot Point∗2)−Previous High;
- Support 2 (S2)=Pivot Point−(Previous High−Previous Low);
- Resistance 1 (R1)=(Pivot Point∗2)−Previous Low;
- Resistance 2 (R2)=Pivot Point+(Previous High−Previous Low); and so on…
Method:
- Set filter we want to activate: R38, S38, RS38 (both), R61, S61, RS61,R78,S78,RS78 … maybe displaying them on chart by lines.
- Sell signal: price is over R38 or R61 or R78 and retraces of at least X points toward PP on current bar open price (Bid <= Open[0]-X).
- Buy signal: price is under S38 or S61 or S78 and retraces of at least X points toward PP on current bar open price (Bid >= Open[0]+X).
- Additional ADR filter: sell if price is “near” ADR High price, buy if price is “near” ADR Min price (we can set a rounding or proximity %).
Pay attention to set max spread and slippage admitted to open trades, to avoid false signals when low liquidity.
Example of weekly chart with SELL signal when price is over the R38 filter we previously set and moves at least 150 points from open bar. No ADR filter.


All Pivot Points Indicator
https://forum.communitypowerea.com/communities/7/topics/814-all-pivot-points-indicator