100% winrate with vegas tunnel with 12EMA, MACD

Avatar
  • updated
  • Checked

This strategy come from my udemy tutor who mentioned 60-70% winrate.

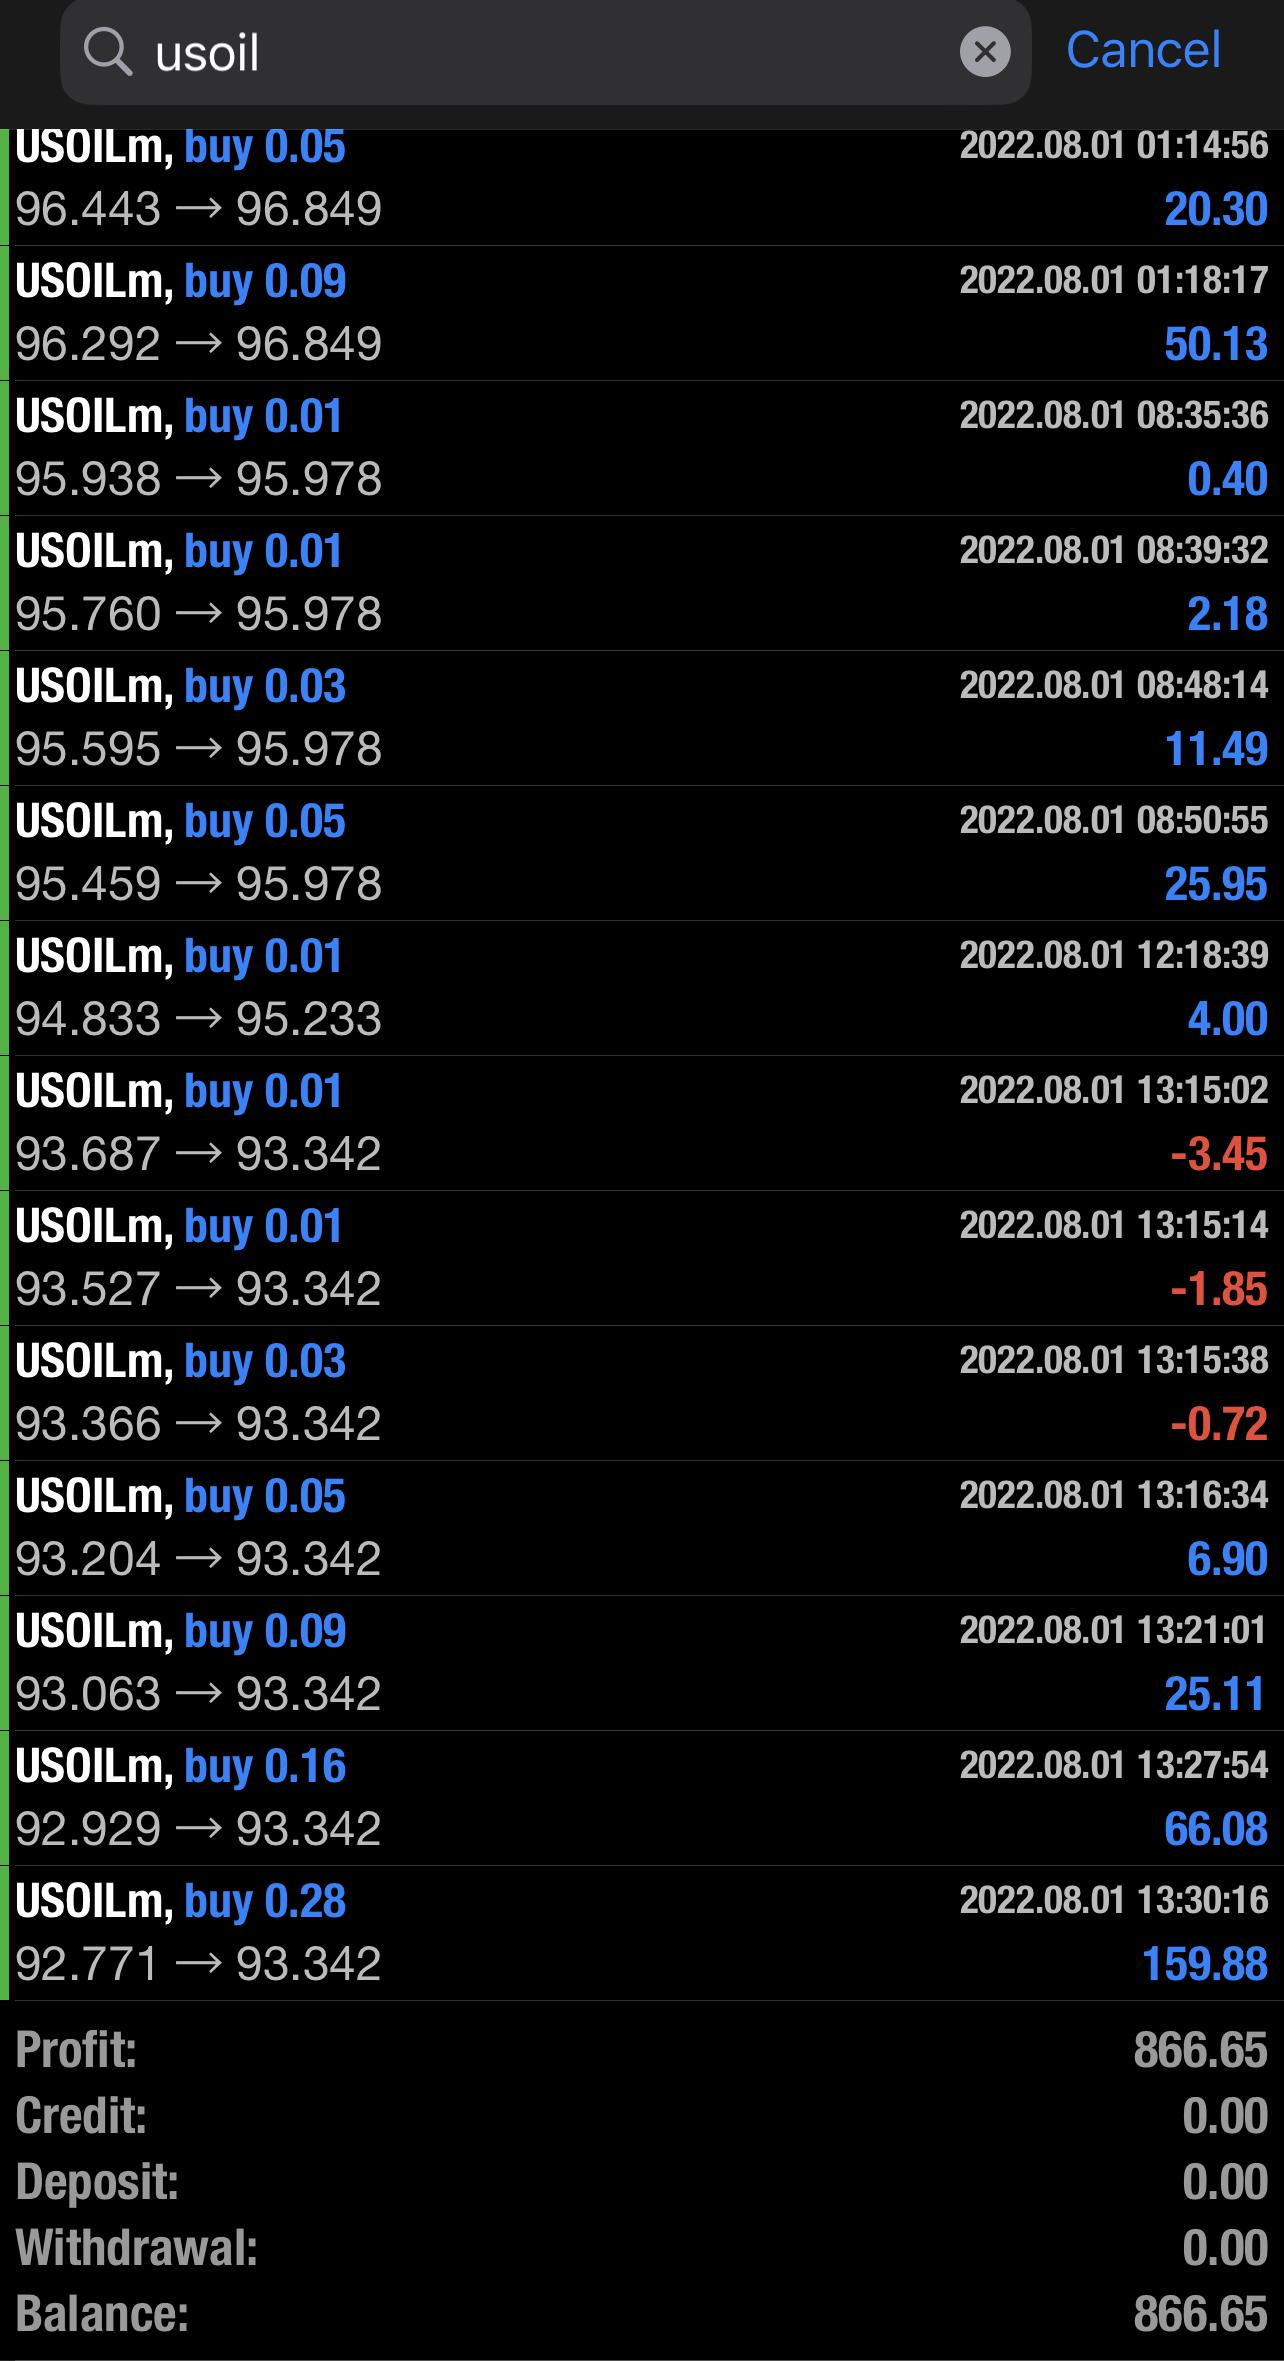
But until now its 100% winrate for me.

Indicators:

EMA 12 

EMA 144,169 (Vegas Tunnel)

MACD

Conditions:

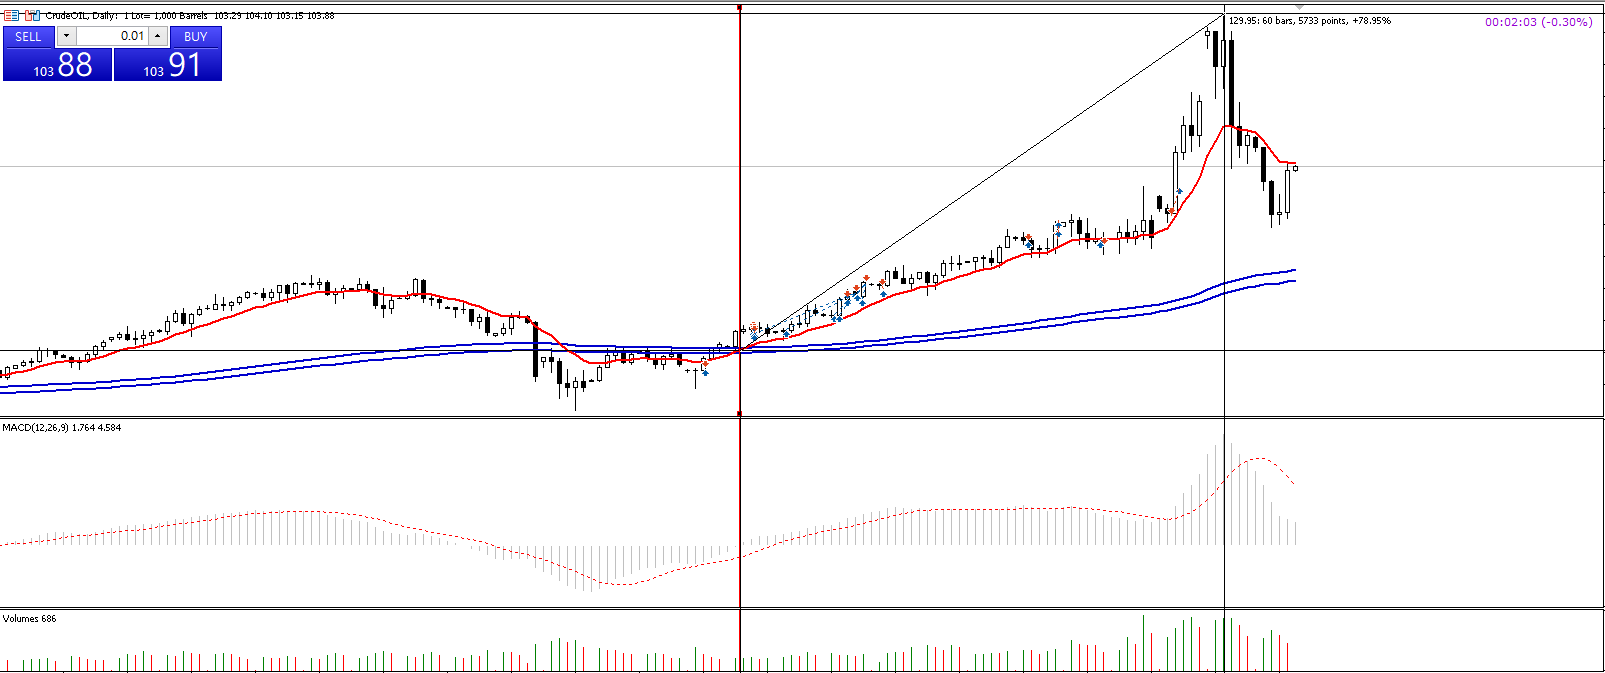
1. When EMA 12 across Vegas Tunnel meanwhile MACD across the zero axis.

2. When EMA 12 above/below the Tunnel, MACD across zero axis temporary and across the zero axis back to its original trend.
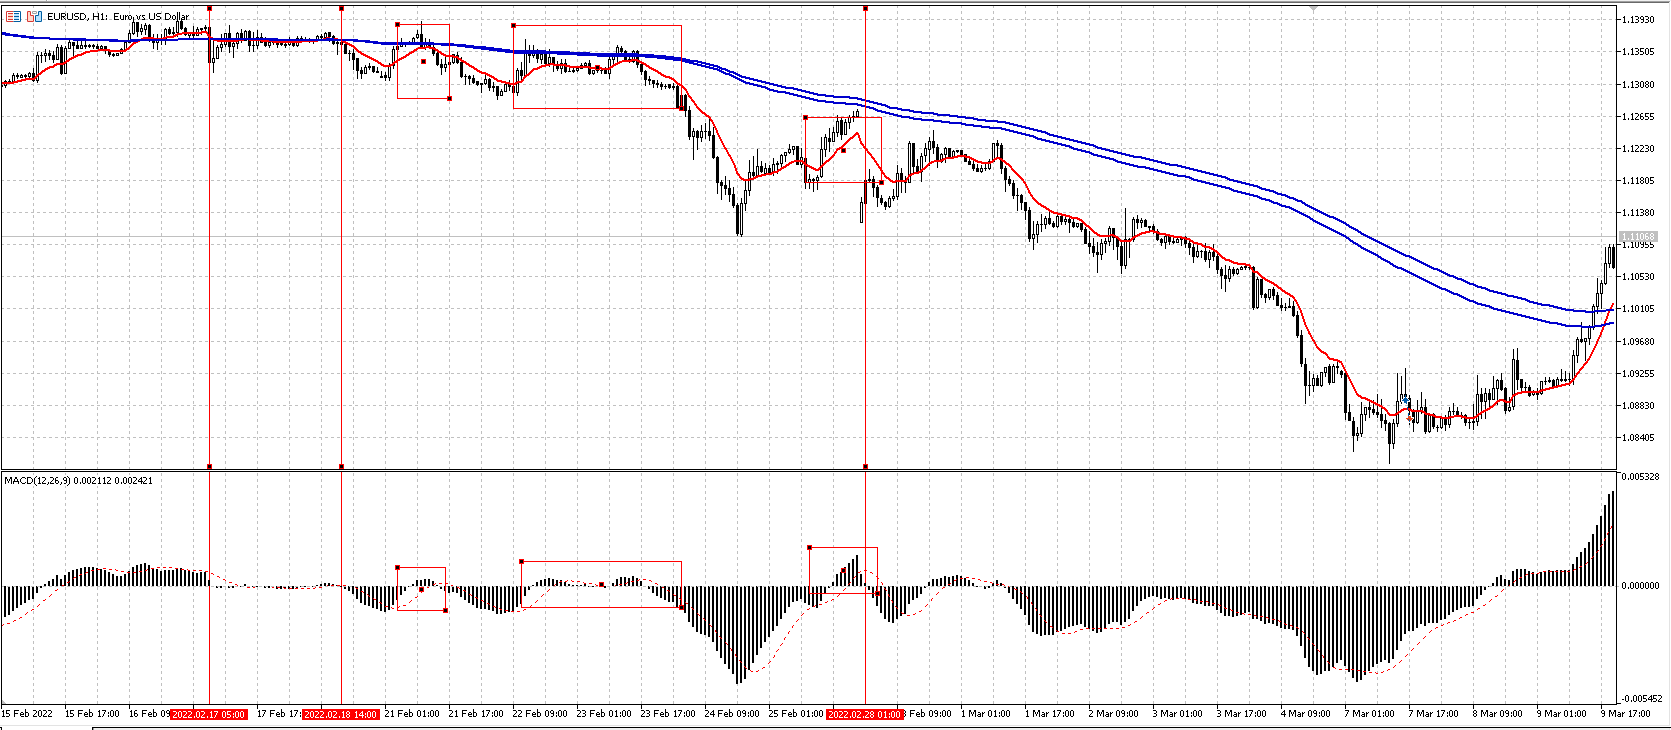
Image 2359

it works in every situation, period that 1hour or above

it helps me predicted a big trend on D1 graph of crude oil that i reached 3400 usd from around 280.

Please build an EA for this strategy because i lack of patient to catch up these rare chance to happens.
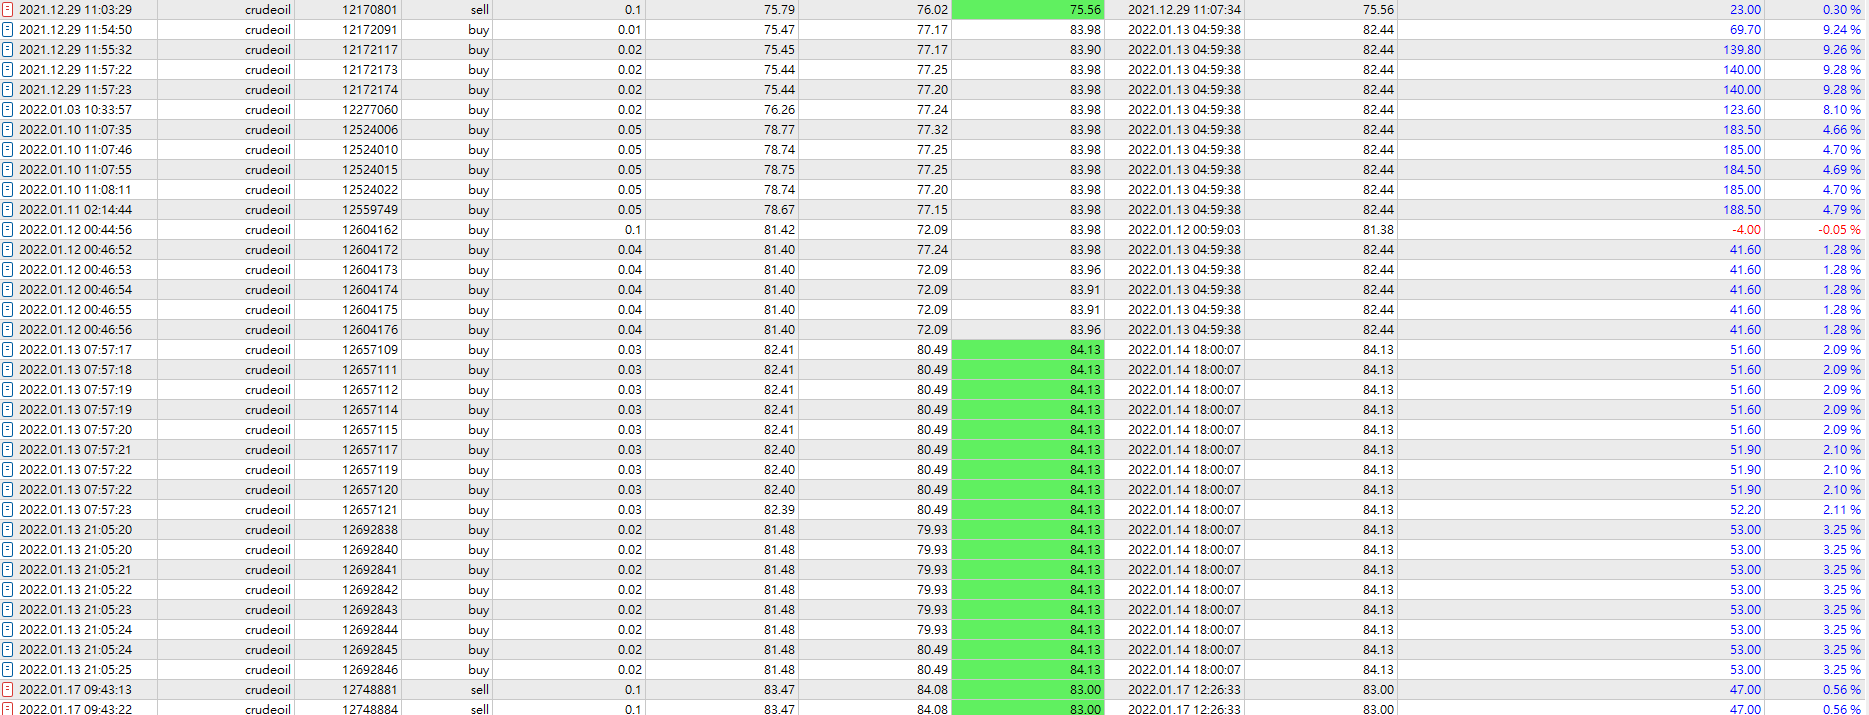
Image 2361

Image 2362

MT version:
EA version:
Symbol:
TimeFrame:
Avatar
PRK
Quote from Jaaang

Just want to share that i have been using this set for USOil under Exness broker on a $1000 live account with 1:200 leverage, so far in 3 weeks I have increase my account to $1866. The max DD I had was $500+

Hi Jaang,

Please share set file for USOIL MT5.

Avatar
Ulises Cune
Quote from felix layi

Can you please share URL to the trades taken by your EA?

This is a community for CP, not for external EAs.

Avatar
felix layi
Quote from HAB_Trader

Normally  not, but in this case it was faster du build an new EA4MA.ex5

Can you please share URL to the trades taken by your EA?

Avatar
HAB_Trader
Quote from Gulm Veriine

I understand now that you are building a robot with ideas you find here. and have no interest in cp testing

Normally  not, but in this case it was faster du build an new EA4MA.ex5

Avatar
Gulm Veriine

I understand now that you are building a robot with ideas you find here. and have no interest in cp testing

Avatar
Gulm Veriine
Quote from HAB_Trader

i wrote an own ea

What do you mean by that.

Avatar
HAB_Trader
Quote from Gulm Veriine

seems intrestging may you share set. maby we can make it bether

i wrote an own ea

Avatar
Gulm Veriine
Quote from HAB_Trader

hi gulm, i wrote a bot with your strategie. Result 2023:

Image 5679

seems intrestging may you share set. maby we can make it bether

Avatar
HAB_Trader
Quote from Gulm Veriine

"Hello guys i want to help all of you and i want to share you some good system.
Like many traders say good system is simple one an that`s why i`ll tell you one very simple.
This is......

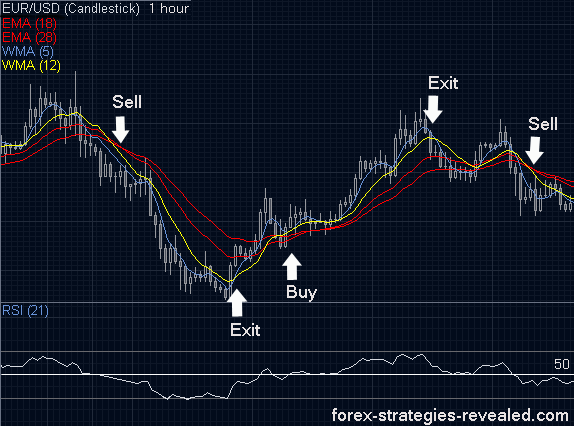
- 1H (of 30MIN, but you will get more whipsaws) candlesticks/bar charts
- 18 EMA & 28 EMA (put them in red)
- 5 WMA (in blue) & 12 WMA (in yellow)
- RSI = 21

The 18 EMA & 28 EMA are two red lines who form a tunnel, these will help you to determine
the start of a rend and the end of a trend.
Long term

The 5 WMA & 12 WMA will show you when to enter a trend, they will also
help you to see the strength of the trends. Short term

Entry Signals
You should only open a position, when the red tunnel is extremely narrow or crossed !

LONG: 5 WMA & 12 WMA cross the red tunnel upwards.
If the 5 WMA also crosses the 12 WMA upwards, then the signal is extra strong.
RSI >50

SHORT: 5 WMA & 12 WMA cross the red tunnel downwards.
If the 5 WMA also crosses the 12 WMA downwards, then the signal is extra strong.
RSI<50

Exit Signals

Signals that show the end of the chosen trend
- Long: The price has reached a top and 5 WMA dives under 12 WMA
Close position

- Short: The price has reached a bottom and 5 WMA jumps above 12 WMA
Close position

Image 5666

Always close your position when boundaries of the red tunnel cross eachother
or when they become so narrow that they are one! This is a clear sign of a trend reversal.
After you see this, close your position and open a new position in the other way
(If you were long, close, open a short position)

When in a trade and the 5 WMA & 12 WMA cross the red tunnel ->
Pay attention! As long as the red tunnel boundaries doesn’t cross
eachother there is no problem, but often this is a sign that they will!"

hi gulm, i wrote a bot with your strategie. Result 2023:

Image 5679

Avatar
Gulm Veriine

"Hello guys i want to help all of you and i want to share you some good system.
Like many traders say good system is simple one an that`s why i`ll tell you one very simple.
This is......

- 1H (of 30MIN, but you will get more whipsaws) candlesticks/bar charts
- 18 EMA & 28 EMA (put them in red)
- 5 WMA (in blue) & 12 WMA (in yellow)
- RSI = 21

The 18 EMA & 28 EMA are two red lines who form a tunnel, these will help you to determine
the start of a rend and the end of a trend.
Long term

The 5 WMA & 12 WMA will show you when to enter a trend, they will also
help you to see the strength of the trends. Short term

Entry Signals
You should only open a position, when the red tunnel is extremely narrow or crossed !

LONG: 5 WMA & 12 WMA cross the red tunnel upwards.
If the 5 WMA also crosses the 12 WMA upwards, then the signal is extra strong.
RSI >50

SHORT: 5 WMA & 12 WMA cross the red tunnel downwards.
If the 5 WMA also crosses the 12 WMA downwards, then the signal is extra strong.
RSI<50

Exit Signals

Signals that show the end of the chosen trend
- Long: The price has reached a top and 5 WMA dives under 12 WMA
Close position

- Short: The price has reached a bottom and 5 WMA jumps above 12 WMA
Close position

Image 5666

Always close your position when boundaries of the red tunnel cross eachother
or when they become so narrow that they are one! This is a clear sign of a trend reversal.
After you see this, close your position and open a new position in the other way
(If you were long, close, open a short position)

When in a trade and the 5 WMA & 12 WMA cross the red tunnel ->
Pay attention! As long as the red tunnel boundaries doesn’t cross
eachother there is no problem, but often this is a sign that they will!"