All 28 Pairs, Bitcoin, Gold, Index with News
Hello Community,
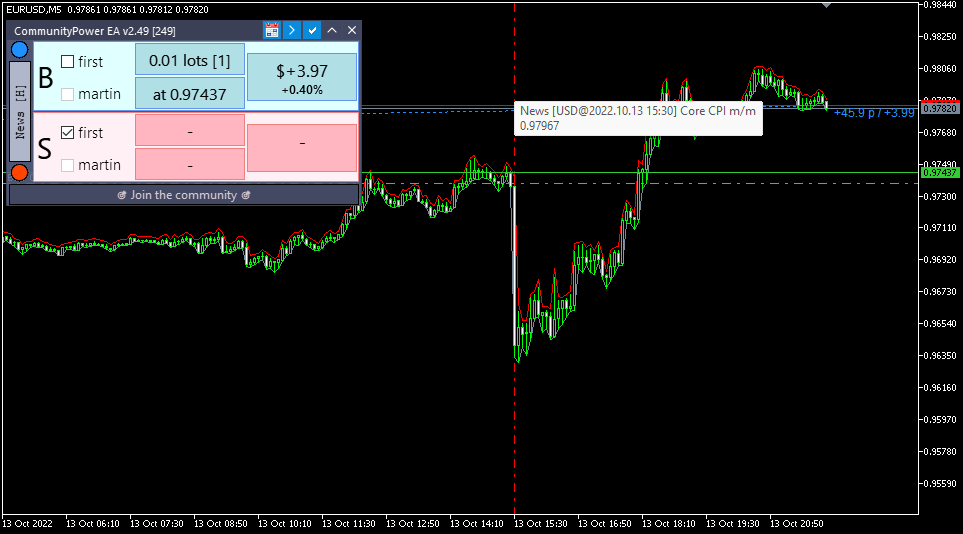
As a result of an idea from a Sai post, to know what happens with certain news in the market.
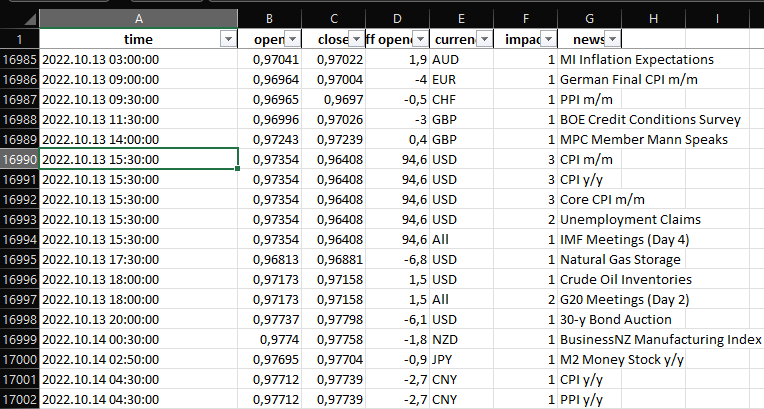
In detail, what I did was take all the 5 minute candles of the symbols and join them with the news in that time range (5 minutes).
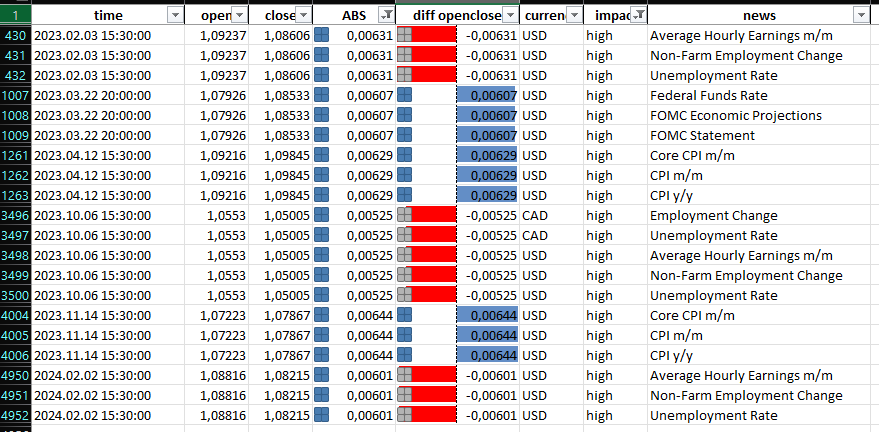
Add a column in which is the difference between Open - Close. Negative values are green candles and positive values are red candles.
This is the result:
Excel.zip
symbols = ['AUDCAD', 'AUDCHF', 'AUDJPY', 'AUDNZD', 'AUDUSD', 'CADCHF', 'CADJPY', 'CHFJPY', 'EURAUD', 'EURCAD', 'EURCHF', 'EURGBP', 'EURJPY', 'EURNZD', 'EURUSD', 'GBPAUD', 'GBPCAD', 'GBPCHF', 'GBPJPY', 'GBPNZD', 'GBPUSD', 'NZDCAD', 'NZDCHF', 'NZDJPY', 'NZDUSD', 'USDCAD', 'USDCHF', 'USDJPY', 'BTCUSD', 'XAUUSD', '.US500Cash', '.US30Cash']


Strategies based on news can be improved, both as to move away from important news, and to take advantage of it and trade on this news


Great! Thanks, Sai and Ulises.
Hi, This is such a great post. Very eye opening. 1) is there a possibility of an update please? Could it perhaps be done on the 1 minute candles? or will there result be the same as the 5 minute candles? Thank you very much for this. Very much appreciated...Keep well.