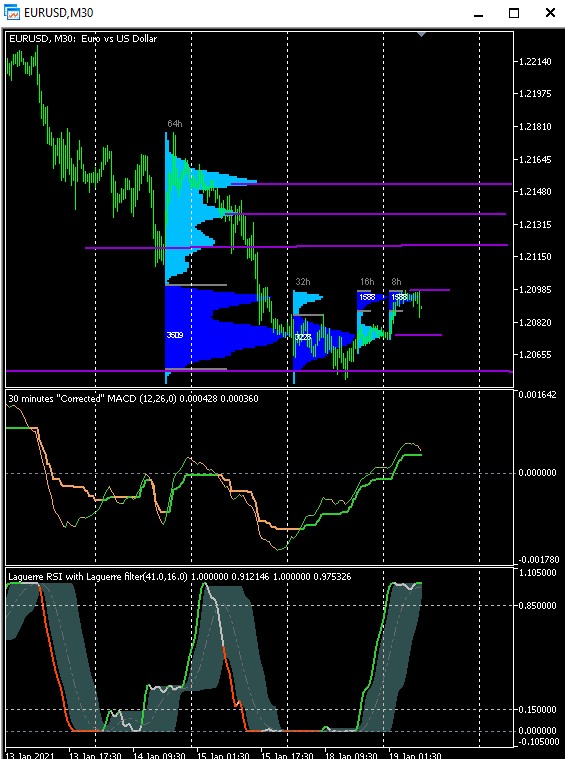
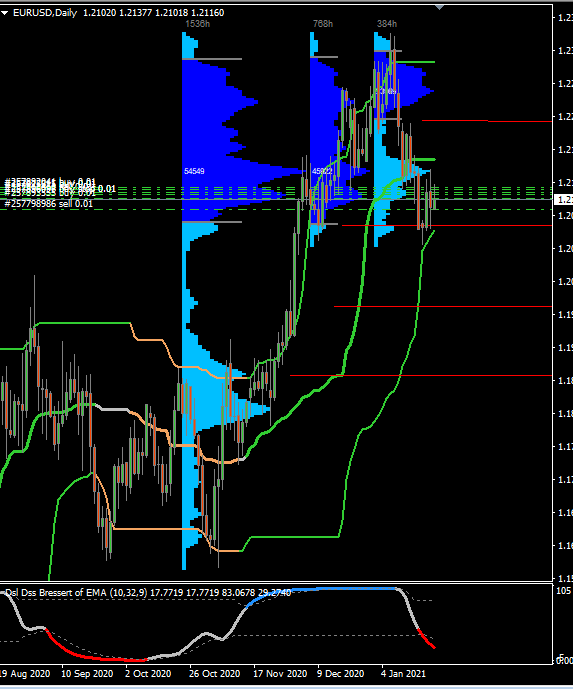
Market profile, volumes

Avatar
  • updated
  • Under review

Image 637

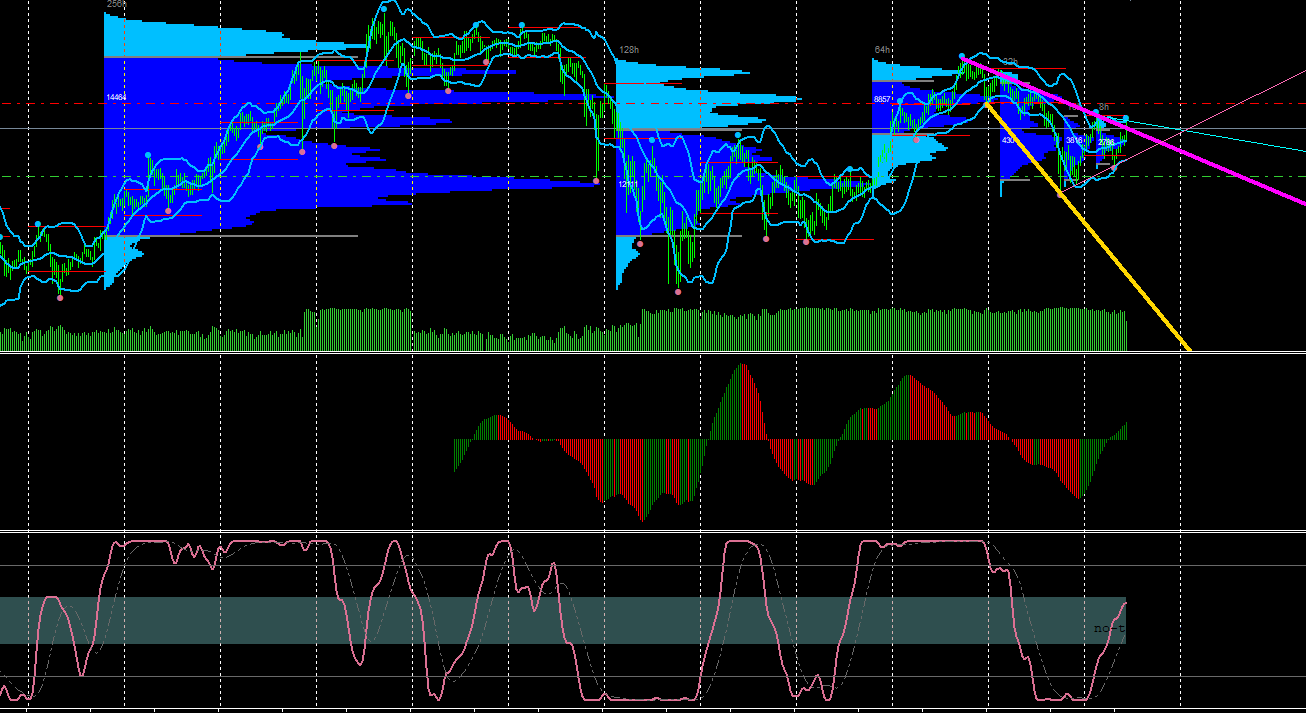
There is no lack of ideas as well as the desire to refine the strategy. Lately I have been trading successfully using Boxprofile together with laguerre RSI, STLM and fractals trend line. The results are very good for the indications of the "Market profile" which makes it clear where the sales and purchases are positioned. It could be an interesting implementation for CP or even for a new project. I await subscriptions of interest

Avatar
0
Andrey Khatimlianskyi
  • Under review

Dante, what do you expect from this topic?

Do you have indicator we can use for signal?

ps: moved this topic to the "suggestiions" forum.

Avatar
0
dante tunica

The market profile is very powerful, but I think we need discretionary sensitivity. The POC is the price level that has been most beaten over time, i.e. where the greatest number of trades have taken place.

Starting from the idea that the price areas most affected over time are the most important areas, we can deduce that these areas are the ones that have attracted most of the contracts and consequently of Volumes. They are supports and resistances. If there are gaps after these areas of large volumes, the market will move very quickly in those areas. For now let's forget it. Thanks Andrey

Avatar
0
Andrey Khatimlianskyi

Why forget? )

Don't you have the indicator? Or don't you like it anymore?

Avatar
0
dante tunica


I am attaching the image indicators.

BoxProfile MT5.ex5

Laguerre RSI with Laguerre filter 1.2.mq5

corrected-macd-indicator.mq5

Avatar
0
dante tunica

Avatar
1
Sai Pratap
Quote from dante tunica

Can u plz explain how to read the indicator and take trades?

Avatar
0
Andrey Khatimlianskyi

And compare them with standard indicators, please

Avatar
0
dante tunica

The correct TF is 30 minutes, but looking at the daily I can more easily explain that "if" the price breaks 1.2060, it quickly drops to 1.1970 and most likely goes to 1.1870 where we find some volumes. If it wants to go up (you never know exactly what the market wants to do) it has a first big obstacle (volumes on sale) 1.2154, but after that, it easily goes up to 1.22320 to stop at 1.2250. These are my readings, not pure gold.

Avatar
0
dante tunica

the code of the market profile is in the public domain, but I am very happy with that of the image the "boxprofile" which is free on the market

marketprofile.mq4

Avatar
0
Sai Pratap
Quote from dante tunica

The correct TF is 30 minutes, but looking at the daily I can more easily explain that "if" the price breaks 1.2060, it quickly drops to 1.1970 and most likely goes to 1.1870 where we find some volumes. If it wants to go up (you never know exactly what the market wants to do) it has a first big obstacle (volumes on sale) 1.2154, but after that, it easily goes up to 1.22320 to stop at 1.2250. These are my readings, not pure gold.

Can u upload the pic with prices. They were cut down!