Pivot Point for signal or confirmation

Avatar
  • updated
  • Completed

Pivot Point is one of the indicator i use the most for my strategies, either confirming trend, breakout retest or consolidation and combining with others indicators ... well used it's a good indicator that give confirmation and objectives.

We could either put support/resistance or only pivot point to see the trend in the timeframe of our choice

An example worth a thousand words

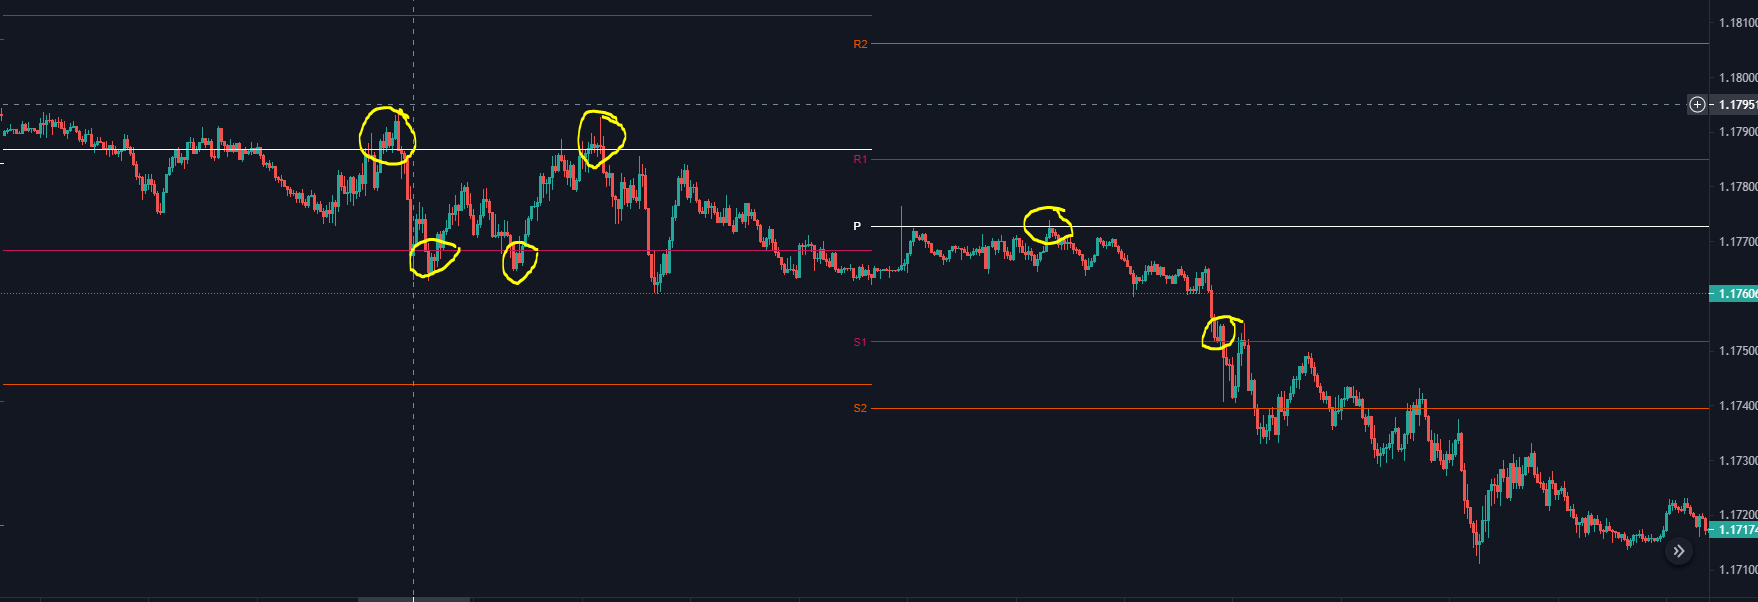
Below is a EURUSD M5 chart with daily Pivot (Short Term)

Image 1087

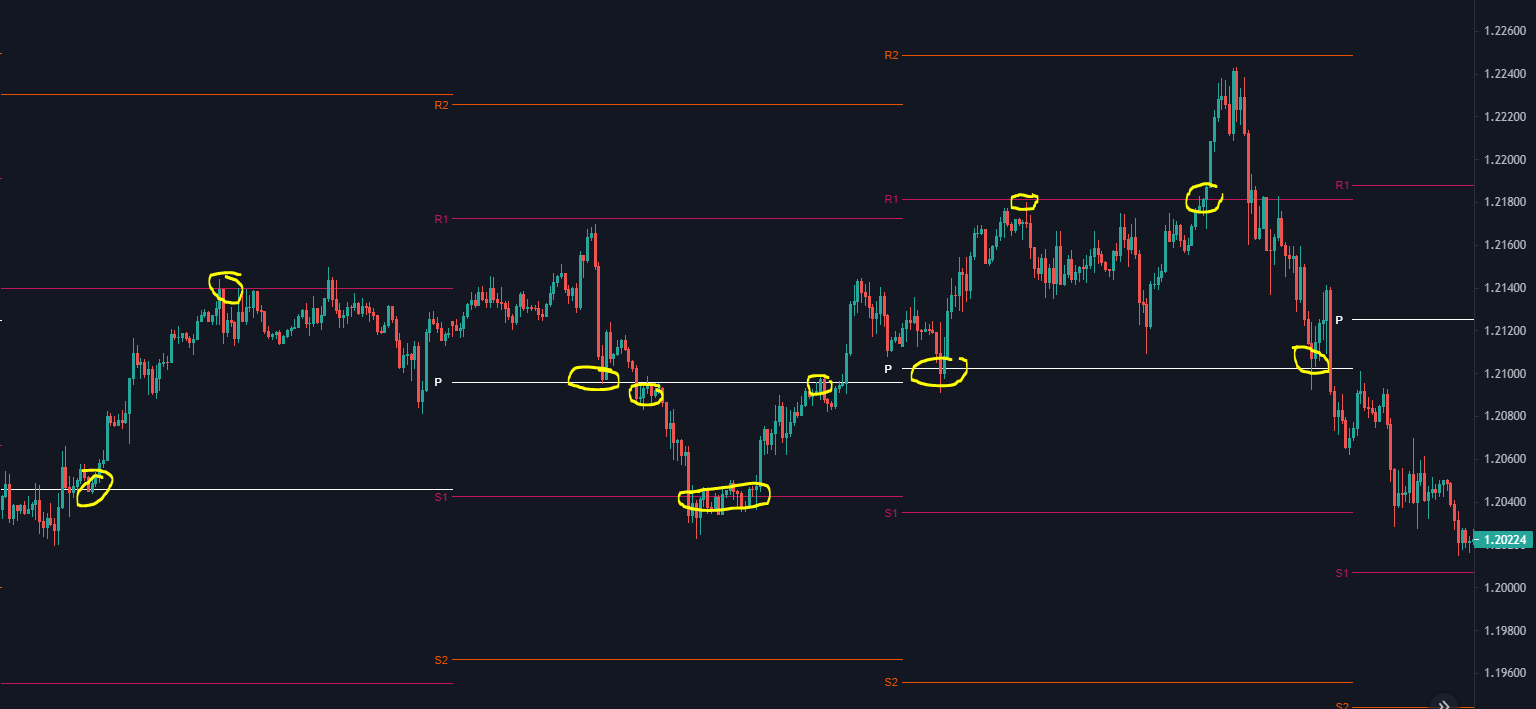
And here EURUSD H1 weekly Pivot

Image 1088

I took the best case scenario for illustrating my thoughts but sometime the market doesn't want to give us profit

For MetaTrader indicators i found for both 4/5

https://www.mql5.com/en/market/product/10298?source=Site+Market+MT5+Indicator+Search+Rating004%3apivot+point

https://www.mql5.com/en/code/10990

Duplicates 2
hello trader i have one strategy i want to convert it into EA but i dont know coding can any one convert this
Support and Resistance/Admiral Pivot (stochastic&RSI) H1and Up

I suggesting to dev adding a support and resistance and Admiral Pivot for Stochastic and Rsi strategy in H1 and higher Timeframe.

its really big help for more accurate signal  less false signal for Stochastic and RSI also this stochastic and Rsi strategy is use to all Forex Symbol i hope the dev add it.

Avatar
0
Miano's Tech
Quote from Sai Pratap

Iam not developer.

To my understanding, I expected it to be of does not make any difference. 

If it really makes difference and if Andrey sir finds the indicator worth it, he will decide to include :)

yeah yahhh you right its up in sir andrey if the indicator is worth it but for me for the other building a strategy using the community power EA is really big help if adding a support resistance or pivot point for better filtering the entry of buying or selling signal in the other indicator like RSI for more accurate signal well its up to sir dev andrey by the way sorry man........

Avatar
0
Andrey Khatimlianskyi
Quote from Miano's Tech

ok dev sorry about that i explain how the indicator work external or built in in the EA and i give a example only so i give the link of other  EA that use external and internal indicator and how it work with the buffer of indicator on EA well I'm not promoting that EA its only example if he want to know how the indicator work in optimizing or create strategy. So he have an idea how the deference of inbuilt indicator to not inbuilt.

by the way sorry dev. well i observe the CP EA and i use it higher timeframe H1 and up with combo of other inbuilt indicator RSI stochastic for long trade and  i notice its need support and resistance. The support and resistance levels help identify the point, which the price is likely to achieve before the reversal of the trend. Use them together with the RSI and you will get a pretty clear picture of a forthcoming trend reversal.

The support and resistance levels are widely used among traders to determine the points of the trend reversal. However, they are not saying much about the direction of this reversal. And this is why it is a very good idea to use some other indicators along the way. This guide’s purpose is to show you how to trade using the support/resistance lines and the Relative Strength Index (RSI).

admiral pivot or pivot point

Pivot points were initially used on stocks and in futures markets, though the indicator has been widely adapted to day trading the forex market.

Pivot points have the advantage of being a leading indicator, meaning traders can use the indicator to gauge potential turning points in the market ahead of time. They can either act as trade entry targets themselves by using them as support or resistance, or as levels for stop-losses and/or take-profit levels.

also dev pivot point its really big help for long trading or intraday trading with help of other indicator like RSI also the other for more accurate confirmation or filter for the signal if reversal or not its really big help

EXAMPLE....


A bullish RSI divergence happens when the price is trending lower (making lower lows), but the RSI makes higher lows in the oversold region (below 30).

If, for instance, this happens on S1, it is a strong signal to buy the underlying market with the expectation that S1 will provide enough support for an uptrend to be kick-started. A stop loss for the buy order can be placed below S2 and S3, with profit targets placed at PP, R1, R2, and R3 or even above.

On the other hand, a bearish divergence occurs when the price is trending higher (making higher highs), but the RSI makes lower highs in the overbought region (above 70). This is a signal that the prevailing uptrend is losing momentum, and a downtrend is about to start.

A bearish divergence happening at the pivot line implies that the price is about to face resistance in the market. For instance, an RSI bearish divergence happening on R1 will prompt sell orders that will target PP, S1, S2, and S3 as profit targets, with stop losses placed above R2 and R3.

When using Pivot Points, it is important to understand that support and resistance lines are action areas. When watching the lines, it is important to trade after confirmation is received.

Thank you for your idea! It would be ideal if you could explain specific rules rather than general strategies.

I combined your topic with the pivot point topic, they are very similar.

Avatar
0
Miano's Tech

thank you very much dev...

Avatar
1
Miano's Tech

Calculation of Pivot Points

The standard Pivot Points indicator that is available on most trading platforms consists of 7 lines: 3 support lines (S1, S2 and S3), 3 resistance lines (R1, R2 and R3) and 1 Pivot Point (PP). The PP acts as a reference point and is used in the computation of the other lines.

Here is the formula for calculating standard Pivot Points:

PP = (High + Low + Close)/3

S1 = (PP * 2) – High

S2 = PP – (High – Low)

S3 = Low – 2(High – PP)

R1 = (PP * 2) – Low

R2 = PP + (High – Low)

R3 = High + 2(PP – Low)

he above is the formula for calculating standard Pivot Points and it uses the High, Low and Close prices of the previous trading period. There are other variations of Pivot Points used by investors, but they all derive support and resistance lines that are watched for trading opportunities.

Here are the formulas for other Pivot Point variations:

Woodie Pivot Points

PP = (H + L + 2C) / 4

R2 = PP + High – Low

R1 = (2 X PP) – Low

S1 = (2 X PP) – High

S2 = PP – High + Low

As the calculations show, Woodie Pivot Points give more weight to the previous closing price when deriving the PP.

Camarilla Pivot Points

PP = (H + L + C) / 3

R4 = C + ((H-L) x 1.5000)

R3 = C + ((H-L) x 1.2500)

R2 = C + ((H-L) x 1.1666)

R1 = C + ((H-L) x 1.0833)

S1 = C – ((H-L) x 1.0833)

S2 = C – ((H-L) x 1.1666)

S3 = C – ((H-L) x 1.2500)

S4 = C – ((H-L) x 1.5000)

Where C = Closing Price, H = High and L = Low

As the calculations show, Camarilla Pivot Points focus more on the previous closing price rather than the PP. All support and resistance lines are derived using a multiplier, with the basic philosophy of Camarilla Pivot Points being that prices will tend to revert to the mean.

Fibonacci Pivot Points

PP = (H + L + C) / 3

R3 = PP + ((High – Low) x 1.000)

R2 = PP + ((High – Low) x .618)

R1 = PP + ((High – Low) x .382)

S1 = PP – ((High – Low) x .382)

S2 = PP – ((High – Low) x .618)

S3 = PP – ((High – Low) x 1.000)

Fibonacci PP are calculated in the same way as standard Pivot Points. The support and resistance levels are then derived by multiplying previous period ranges (High – Low) with corresponding Fibonacci levels, such as 38.2%. 61.8% and 100%.

i have this kind of indicator setting i try to find it and share here.

Avatar
2
Miano's Tech

PivotPoints.All-In-One.ex5

here the pivot point indicator its all in one! All of that is in the setting of the indicator i hope its help....

its very strong pivot indicator

Avatar
2

Very active topic. I guess it will be implemented soon.

Avatar
2
Sai Pratap
Quote from Andrey Khatimlianskyi

Very active topic. I guess it will be implemented soon.

Yeah sir. Badly waiting for it, with CP having its own pivot indicator. :)

Avatar
3
Andrey Khatimlianskyi
  • Started
Avatar
2
Andrey Khatimlianskyi
  • Completed