"AUNZ Matrix" - Arbitraging on AUDNZD

Hi fellow traders,
I'd like to introduce you to a trading strategy I've developed called the "AUNZ Matrix", that leverages the historical correlation between the Australian dollar (AUD) and the New Zealand dollar (NZD).
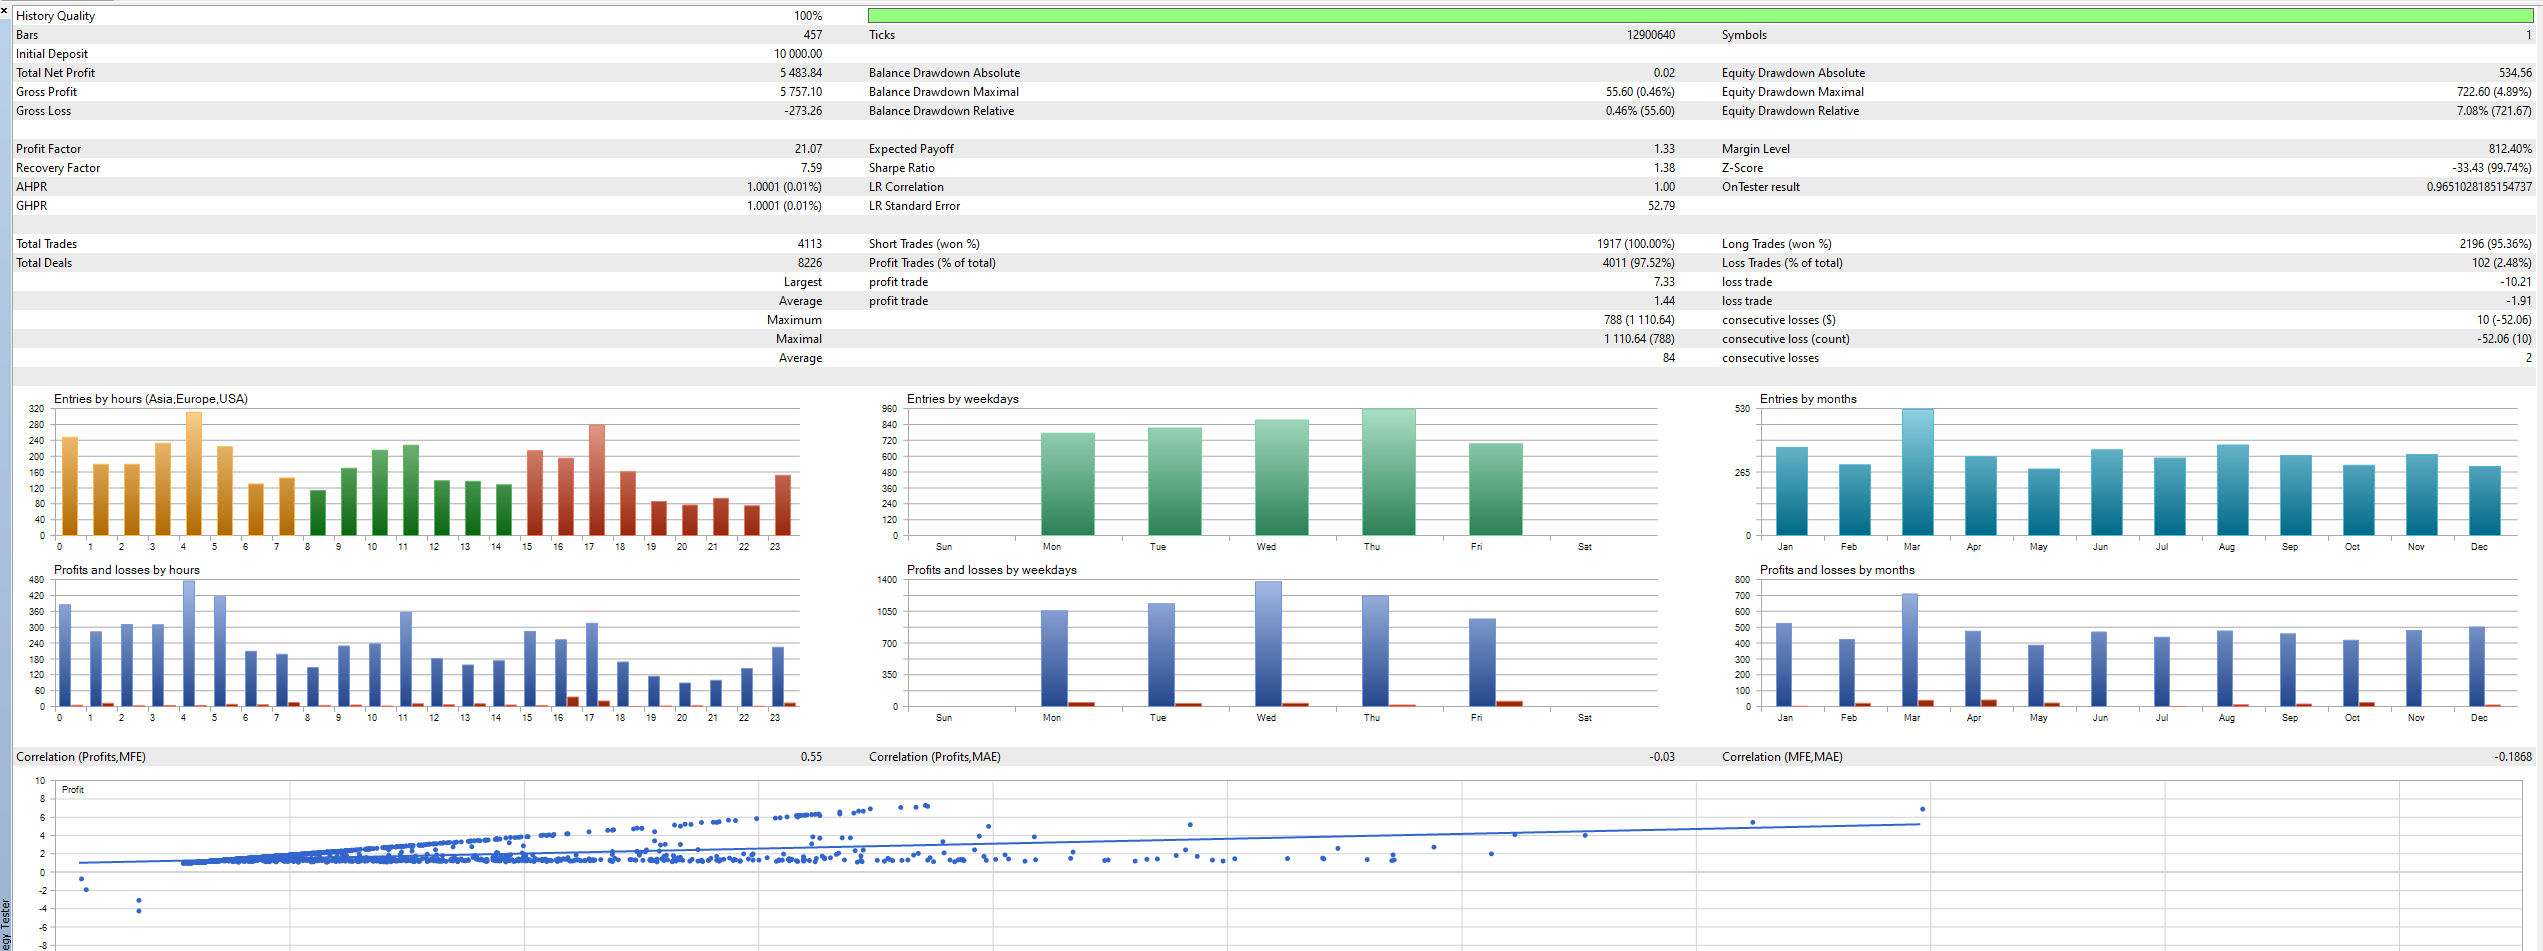
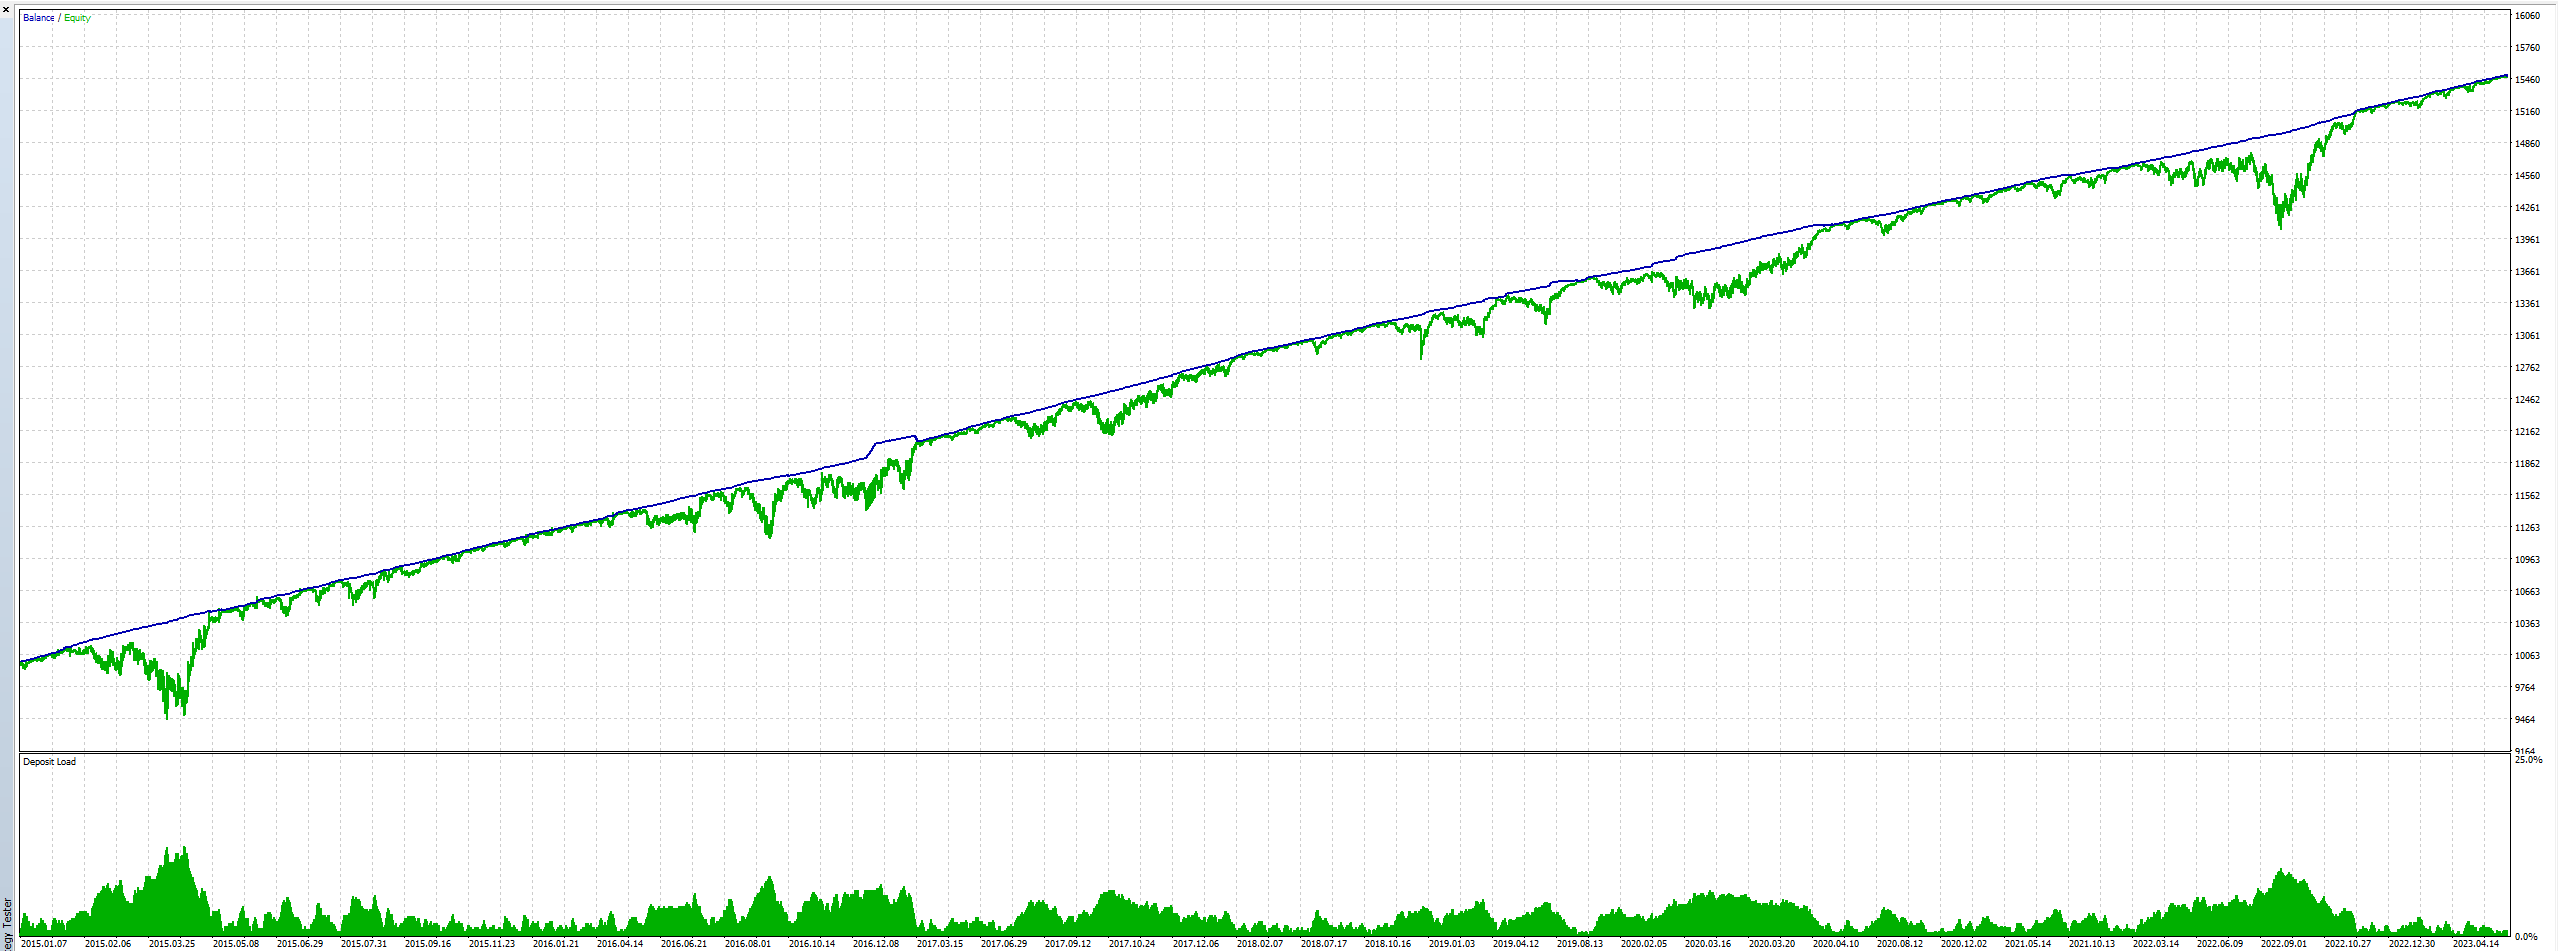
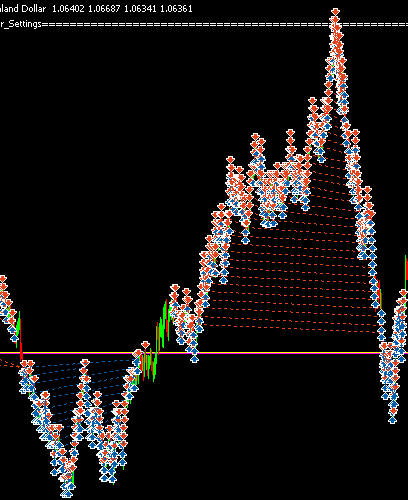
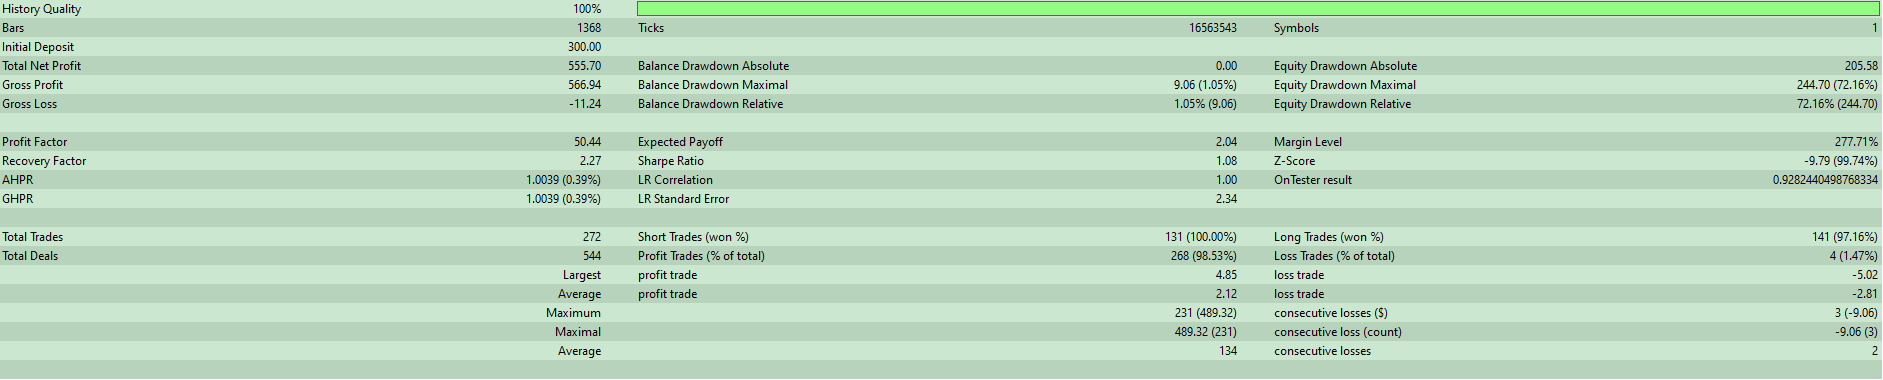
The Basic Idea: The core concept of the AUNZ Matrix is to create a grid of buy and sell orders on the AUDNZD pair. This currency pair has predominantly traded in a sideways range between 1.14 and 1.03 over the past decade. Each order within the grid comes with its own trailing exit. The primary objective is to generate consistent, albeit modest, profits by closing multiple orders within the grid. No Stop Losses are employed in this strategy.
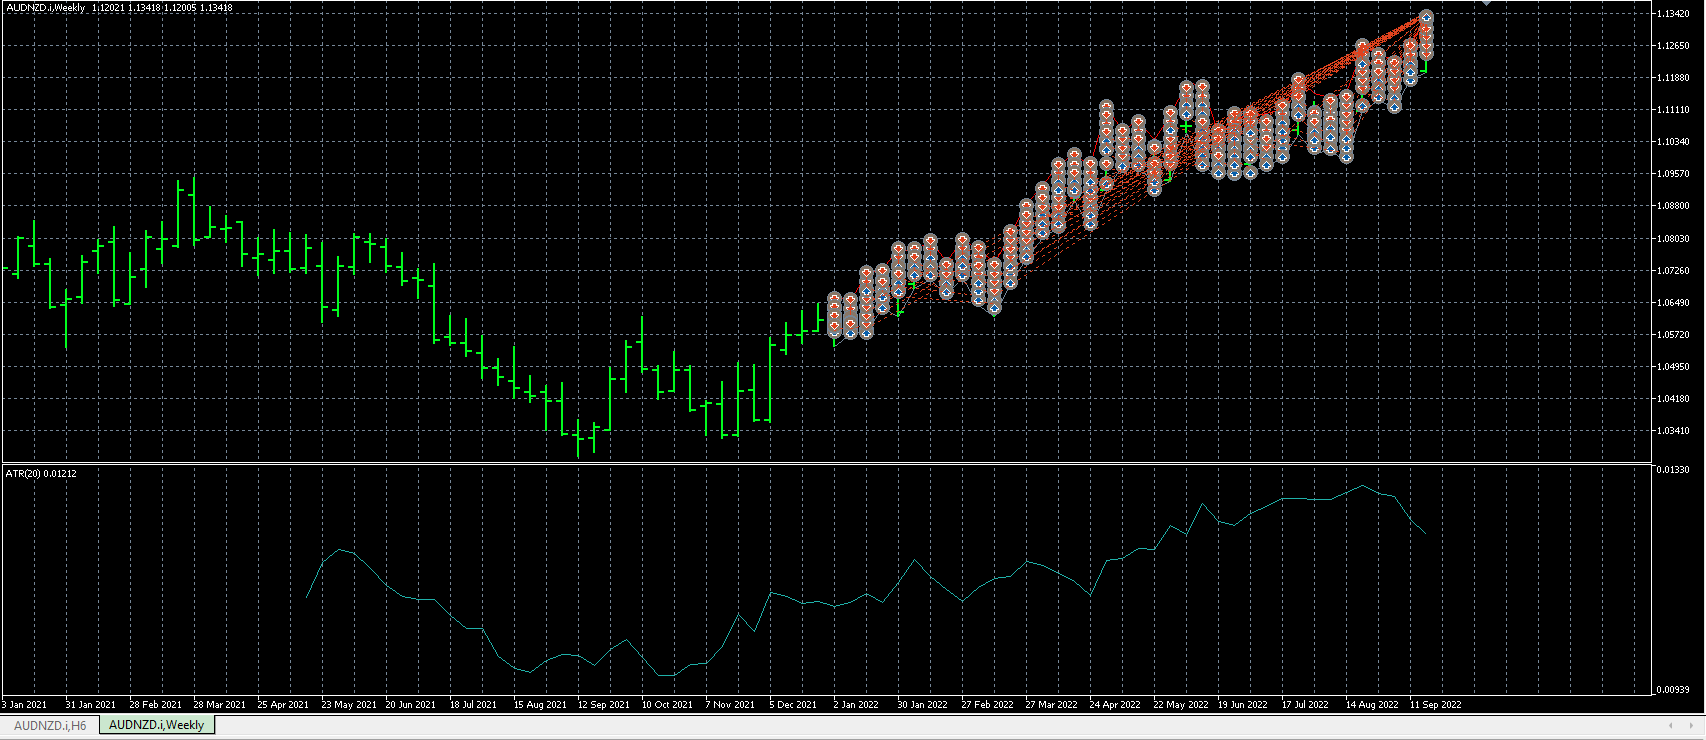
the Dynamic Virtual Wall: While the basic strategy does work, it can result in a significant deposit load and a high drawdown percentage. To address this issue, I've incorporated a "dynamic virtual wall" into the strategy. This virtual wall divides the grid into two distinct zones: an upper zone and a lower zone. The wall is constructed using a weekly Bollinger Band with a 100-period SMA and a 0.5 deviation.
The virtual wall serves as a filter for the grid orders. In the upper zone, only sell orders are allowed, and in the lower zone, only buy orders are permitted. This adjustment dramatically reduces deposit load and drawdown percentage, albeit at a slight reduction in profit. Additional filters can be implemented to optimize performance further.
Risk and Limitations: It's crucial to acknowledge the main risk associated with the "AUNZ Matrix" strategy. The primary risk factor is the potential decorrelation of the AUD and NZD. This can occur if the respective central banks change their monetary policy. Traders following this strategy must closely monitor central bank actions and be prepared to pause the bot if any significant policy changes are anticipated.
This precaution may result in some losses if the bot has open orders at the time of a potential decorrelation event. However, it's a necessary measure to protect your capital and align the strategy with changing market conditions.
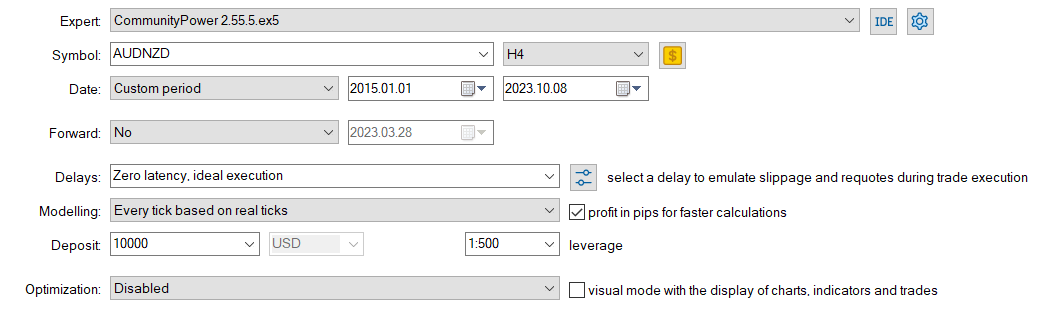
Set File: I've attached a set file that you can use to test this strategy on your own. It serves as a starting point for further experimentation. You have the flexibility to tweak the parameters of the "martingale" grid or incorporate additional indicators and techniques to enhance its performance.
Exploring Future Possibilities: In my ongoing exploration of this strategy, I'm interested in developing a volatility-based grid, where the step size of the grid adjusts dynamically according to market conditions. Unfortunately, I haven't found a way to implement this with this EA yet. It appears that the "change steps" parameter does not function correctly when individual exits are used. It also seems that individual take profit, with volatility coef does not work properly.
If anyone has insights into achieving this, please share your knowledge. Incremental step adjustments could be intriguing for incorporating very light lot multiplier techniques. After all, based on the core concept of this strategy, raising the aggressivity when the price action reach the boundaryes of the ranging channel could make sense.
CP Section used:
"Martingale Properties", for creating the grid.
"Individual Order Properties", for creating the individual exits.
"MA Filter #1 Prop." & "Volatility for Ma": for creating the Bollinger Bands
That's all.
I hope you find the "AUNZ Matrix" strategy intriguing as i do. Let's try to improve its performance and create a nice "ATM" by arbitraging the Kiwi Aussie correlation together. So feel free to share your thoughts and results.
Happy trading! ^^

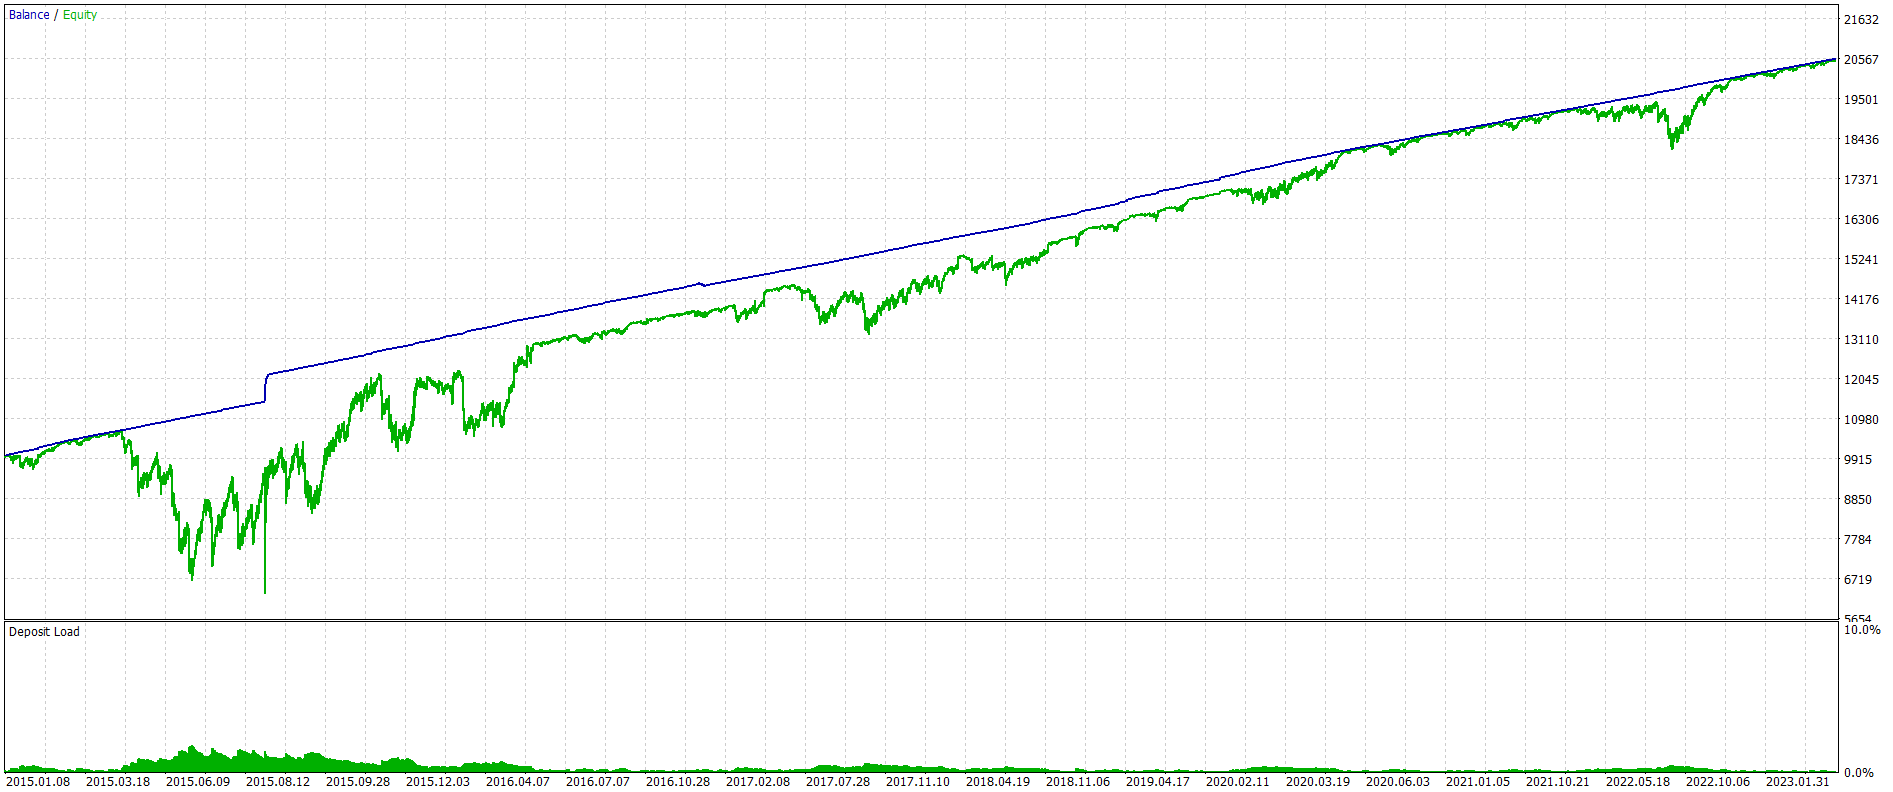


Hey nice set
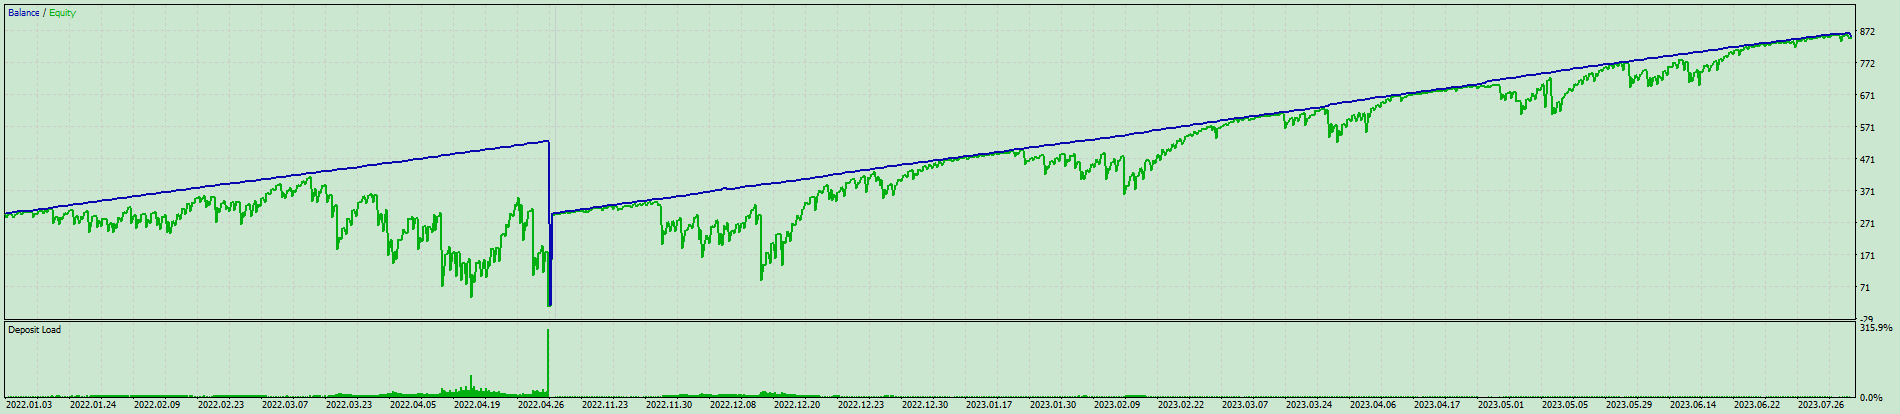
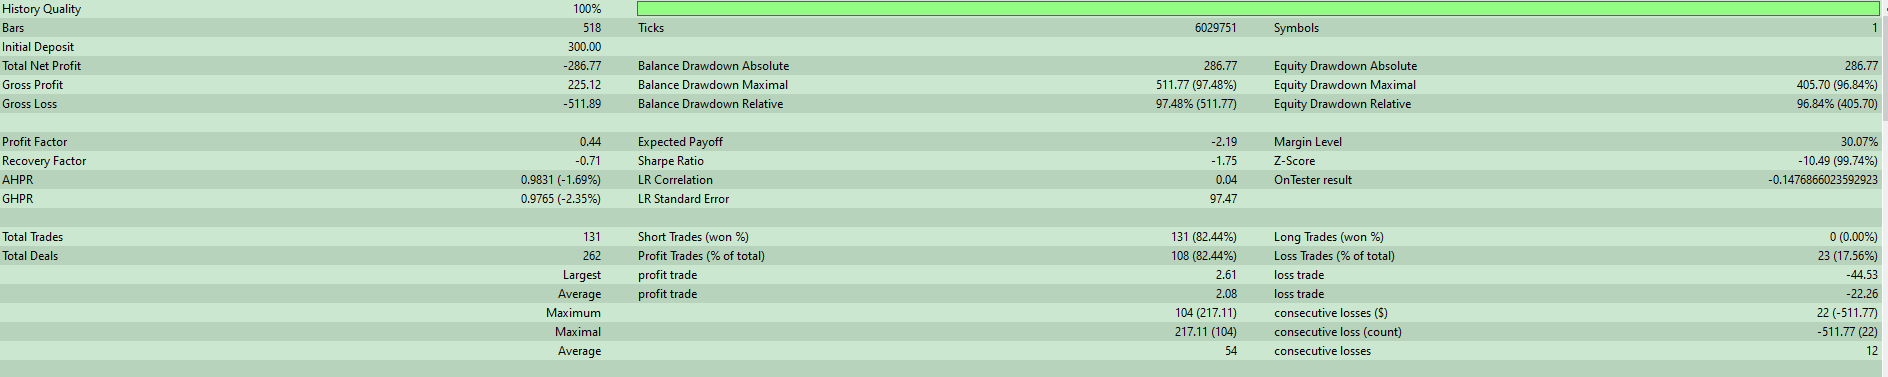
This is ICmarkets demo account
Timeframe H4 using your set